Download source and data
NetCDF Temperature Example
#Metview Macro
# **************************** LICENSE START ***********************************
#
# Copyright 2019 ECMWF. This software is distributed under the terms
# of the Apache License version 2.0. In applying this license, ECMWF does not
# waive the privileges and immunities granted to it by virtue of its status as
# an Intergovernmental Organization or submit itself to any jurisdiction.
#
# ***************************** LICENSE END ************************************
#
# read ERA5 monthly mean - downloaded from CDS
nc = read("era5_2000_aug.nc")
# our NetCDF data is CF-compliant and has the following
# structure:
#
# dimensions:
# longitude = 1440 ;
# latitude = 721 ;
# time = 1 ;
# variables:
# float longitude(longitude) ;
# float latitude(latitude) ;
# int time(time) ;
# short t2m(time, latitude, longitude) ;
# define netcdf plotting based on the data structure above
vis = netcdf_visualiser(
netcdf_plot_type : "geo_matrix",
netcdf_latitude_variable : "latitude",
netcdf_longitude_variable : "longitude",
netcdf_value_variable : "t2m",
netcdf_data : nc
)
# define contour shading
cont = mcont(
contour_automatic_setting : "style_name",
contour_style_name : "sh_all_fM52t48i4_light",
legend : "on"
)
# define coastlines
coastlines = mcoast(
map_coastline_thickness : 2,
map_label_height : 0.2
)
# define projection
view = geoview(
map_projection : "mollweide",
subpage_clipping : "on",
coastlines : coastlines
)
# define title
title = mtext(
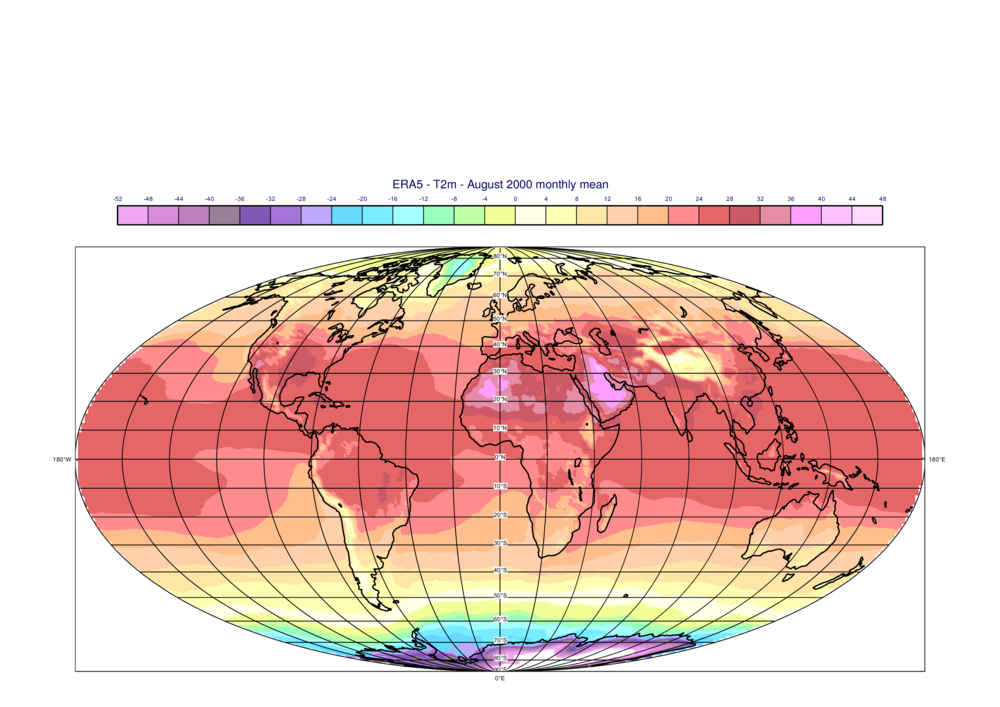
text_lines : ["ERA5 - T2m - August 2000 monthly mean"],
text_font_size : 0.4
)
# define output
setoutput(pdf_output(output_name : 'nc_era5_t2'))
# generate plot
plot(view, vis, cont, title)
NetCDF Temperature Example
#  **************************** LICENSE START ***********************************
#
#  Copyright 2019 ECMWF. This software is distributed under the terms
#  of the Apache License version 2.0. In applying this license, ECMWF does not
#  waive the privileges and immunities granted to it by virtue of its status as
#  an Intergovernmental Organization or submit itself to any jurisdiction.
#
#  ***************************** LICENSE END ************************************
#

import metview as mv

# read ERA5 monthly mean - downloaded from CDS
nc = mv.read("era5_2000_aug.nc")

# our NetCDF data is CF-compliant and has the following
# structure:
#
# dimensions:
#	longitude = 1440 ;
#	latitude = 721 ;
#	time = 1 ;
# variables:
#	float longitude(longitude) ;
#	float latitude(latitude) ;
#	int time(time) ;
#	short t2m(time, latitude, longitude) ;

# define netcdf plotting based on the data structure above
vis = mv.netcdf_visualiser(
    netcdf_plot_type            = "geo_matrix",
    netcdf_latitude_variable    = "latitude",
    netcdf_longitude_variable   = "longitude",
    netcdf_value_variable       = "t2m",
    netcdf_data                 = nc
    )

# define contour shading
cont = mv.mcont(
    contour_automatic_setting = "style_name",
    contour_style_name        = "sh_all_fM52t48i4_light",
    legend                    = "on"
    )

# define coastlines
coastlines = mv.mcoast(
    map_coastline_thickness = 2,
    map_label_height        = 0.2
    )

# define projection
view = mv.geoview(
    map_projection   = "mollweide",
    subpage_clipping = "on",
    coastlines       = coastlines
    )

# define title
title = mv.mtext(
    text_lines = ["ERA5 - T2m - August 2000 monthly mean"],
    text_font_size = 0.4
)

# define output
mv.setoutput(mv.pdf_output(output_name = 'nc_era5_t2'))

# generate plot
mv.plot(view, vis, cont, title)