Download source and data
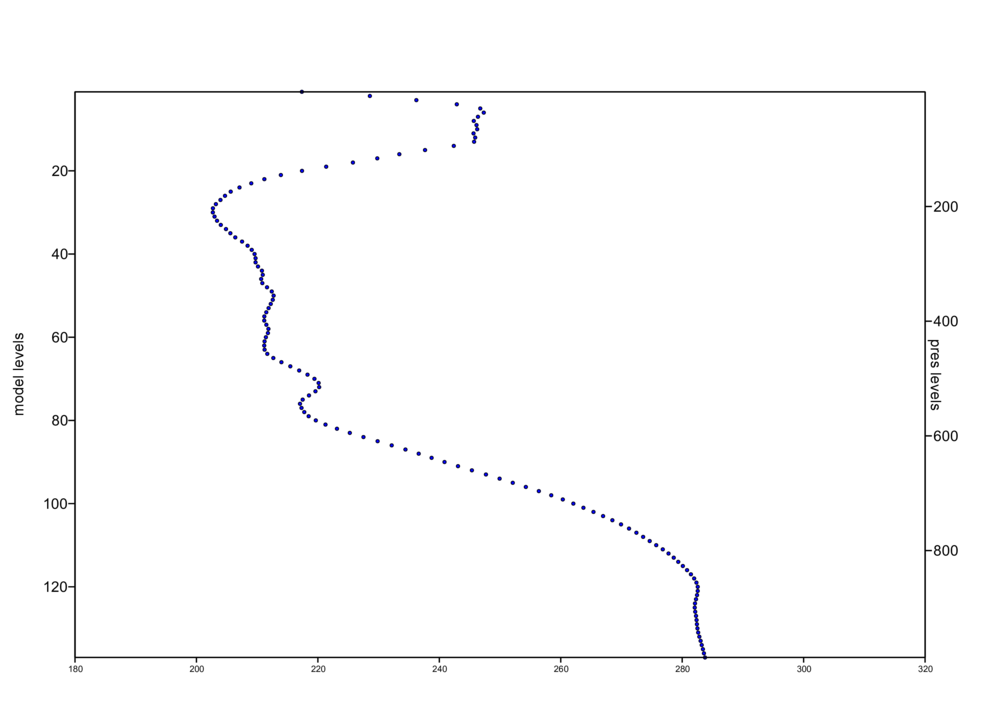
Profile Plot with Double Axis Example
# Metview Macro

#  **************************** LICENSE START ***********************************
#
#  Copyright 2020 ECMWF. This software is distributed under the terms
#  of the Apache License version 2.0. In applying this license, ECMWF does not
#  waive the privileges and immunities granted to it by virtue of its status as
#  an Intergovernmental Organization or submit itself to any jurisdiction.
#
#  ***************************** LICENSE END ************************************


# -------------------------------------------------------------------------
# Description: Demonstrates how to make a graph plot with two vertical axes
# -------------------------------------------------------------------------

# We will compute a vertical profile from a point in a data set
# that is on model levels. This will be plotted with model levels
# as the left-hand vertical axis, and computed pressure levels on the
# right-hand vertical axis.


lat_lon_point = [56.9, -2.6]

# read the input model level grib file and compute a profile curve from it
t_data = read(source: "fc_ml.grib", parameter:'t')

model_levels = grib_get_long(t_data, 'level')

iv1 = input_visualiser(
    input_x_values : nearest_gridpoint(t_data, lat_lon_point),
    input_y_values : model_levels
    )

dots = msymb(
    symbol_type         : "marker",
    symbol_outline      : "on",
    symbol_marker_index : 15
    )


# read the LNSP file and compute pressure levels for the input model levels
lnsp_data = read("lnsp.grib")

pressure_fields = pressure(lnsp_data, t_data)
pressure_levels = nearest_gridpoint(pressure_fields, lat_lon_point) / 100


# Construct two Cartesian views; the first will be plotted with data, the
# second will be plotted without data in order to plot just its vertical axis

# set up the main Cartesian view - it has a left-hand vertical axis
primary_vertical_axis = maxis(
    axis_orientation      : "vertical",
    axis_title_text       : "model levels",
    axis_title_height     : 0.5,
    axis_tick_label_hight : 0.5
    )

c1 = cartesianview(
    y_min         : maxvalue(vector(model_levels)), # larger level usually at bottom
    y_max         : minvalue(vector(model_levels)),
    x_min         : 180, # Kelvin
    x_max         : 320, # Kelvin
    vertical_axis : primary_vertical_axis
    )


# set up the secondary Cartesian view with a right-hand vertical axis
secondary_vertical_axis = maxis(
    axis_orientation      : "vertical",
    axis_position         : "right",
    axis_title_text       : "pres levels",
    axis_title_height     : 0.5,
    axis_tick_label_hight : 0.5
    )

# switch off the plotting of its horizontal axis
secondary_horizontal_axis = maxis(
    axis_line       : 'off',
    axis_tick       : 'off',
    axis_tick_label : 'off'
    )

c2 = cartesianview(
    y_min           : maxvalue(vector(pressure_levels)),
    y_max           : minvalue(vector(pressure_levels)),
    vertical_axis   : secondary_vertical_axis,
    horizontal_axis : secondary_horizontal_axis)


# set up the pages that will use these views
p1 = plot_page(view  : c1)
p2 = plot_page(view : c2)
dw = plot_superpage(pages : [p1,p2])


# define the output plot file
setoutput(pdf_output(output_name : 'double_axis_1'))

# plot the data into the first view, then plot the second view empty
plot(dw[1],iv1,dots,dw[2])
Profile Plot with Double Axis Example
# Metview Example

#  **************************** LICENSE START ***********************************
#
#  Copyright 2020 ECMWF. This software is distributed under the terms
#  of the Apache License version 2.0. In applying this license, ECMWF does not
#  waive the privileges and immunities granted to it by virtue of its status as
#  an Intergovernmental Organization or submit itself to any jurisdiction.
#
#  ***************************** LICENSE END ************************************

import metview as mv

# -------------------------------------------------------------------------
# Description: Demonstrates how to make a graph plot with two vertical axes
# -------------------------------------------------------------------------

# We will compute a vertical profile from a point in a data set
# that is on model levels. This will be plotted with model levels
# as the left-hand vertical axis, and computed pressure levels on the
# right-hand vertical axis.


lat_lon_point = [56.9, -2.6]

# read the input model level grib file and compute a profile curve from it
t_data = mv.read(source="fc_ml.grib", parameter='t')

model_levels = mv.grib_get_long(t_data, 'level')

iv1 = mv.input_visualiser(
    input_x_values = mv.nearest_gridpoint(t_data, lat_lon_point),
    input_y_values = model_levels
    )

dots = mv.msymb(
    symbol_type         = "marker",
    symbol_outline      = "on",
    symbol_marker_index = 15
    )


# read the LNSP file and compute pressure levels for the input model levels
lnsp_data = mv.read("lnsp.grib")

pressure_fields = mv.pressure(lnsp_data, t_data)
pressure_levels = mv.nearest_gridpoint(pressure_fields, lat_lon_point)
pressure_levels = [x / 100 for x in pressure_levels]


# Construct two Cartesian views; the first will be plotted with data, the
# second will be plotted without data in order to plot just its vertical axis

# set up the main Cartesian view - it has a left-hand vertical axis
primary_vertical_axis = mv.maxis(
    axis_orientation      = "vertical",
    axis_title_text       = "model levels",
    axis_title_height     = 0.5,
    axis_tick_label_hight = 0.5
    )

c1 = mv.cartesianview(
    y_min         = max(model_levels), # larger level usually at bottom
    y_max         = min(model_levels),
    x_min         = 180, # Kelvin
    x_max         = 320, # Kelvin
    vertical_axis = primary_vertical_axis
    )


# set up the secondary Cartesian view with a right-hand vertical axis
secondary_vertical_axis = mv.maxis(
    axis_orientation      = "vertical",
    axis_position         = "right",
    axis_title_text       = "pres levels",
    axis_title_height     = 0.5,
    axis_tick_label_hight = 0.5
    )

# switch off the plotting of its horizontal axis
secondary_horizontal_axis = mv.maxis(
    axis_line       = 'off',
    axis_tick       = 'off',
    axis_tick_label = 'off'
    )

c2 = mv.cartesianview(
    y_min           = max(pressure_levels),
    y_max           = min(pressure_levels),
    vertical_axis   = secondary_vertical_axis,
    horizontal_axis = secondary_horizontal_axis)


# set up the pages that will use these views
p1 = mv.plot_page(view = c1)
p2 = mv.plot_page(view = c2)
dw = mv.plot_superpage(pages = [p1,p2])


# define the output plot file
mv.setoutput(mv.pdf_output(output_name = 'double_axis_1'))

# plot the data into the first view, then plot the second view empty
mv.plot(dw[0],iv1,dots,dw[1])