Download source and data
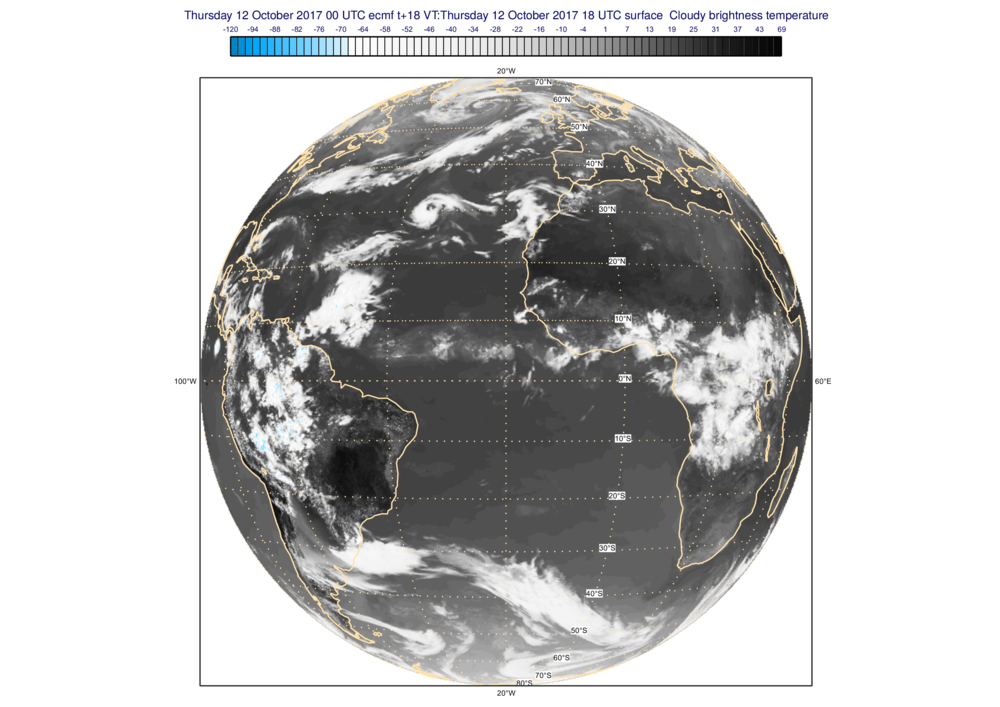
Simulated Satellite Image Example
#Metview Macro

#  **************************** LICENSE START ***********************************
#
#  Copyright 2019 ECMWF. This software is distributed under the terms
#  of the Apache License version 2.0. In applying this license, ECMWF does not
#  waive the privileges and immunities granted to it by virtue of its status as
#  an Intergovernmental Organization or submit itself to any jurisdiction.
#
#  ***************************** LICENSE END ************************************
#

# read simulated satellite image
g = read("sim_ir9.grib")

# define automatic contour shading
shading = mcont(
    contour_automatic_setting : "ecmwf",
    legend : "on"
    )

# define coastlines
coastlines = mcoast(
    map_coastline_colour    : "cream",
    map_coastline_thickness : 2,
    map_grid_line_style     : "dot",
    map_grid_colour         : "cream"
    )

# define map projection
view = geoview(
    map_projection         : "geos",
    map_vertical_longitude : -20,
    subpage_x_position     : 20,
    subpage_y_position     : 3,
    subpage_x_length       : 86,
    subpage_y_length       : 86,
    coastlines             : coastlines
    )

# define legend
legend = mlegend(
    legend_text_font_size  : 0.25,
    legend_label_frequency : 3
    )

# define title
title = mtext(text_font_size : 0.4)

# define the output plot file
setoutput(pdf_output(output_name : 'simulated_sat_img'))

# generate plot
plot(view, g, shading, legend, title)
Simulated Satellite Image Example
#  **************************** LICENSE START ***********************************
#
#  Copyright 2019 ECMWF. This software is distributed under the terms
#  of the Apache License version 2.0. In applying this license, ECMWF does not
#  waive the privileges and immunities granted to it by virtue of its status as
#  an Intergovernmental Organization or submit itself to any jurisdiction.
#
#  ***************************** LICENSE END ************************************
#
import metview as mv

# read simulated satellite image
g = mv.read("sim_ir9.grib")

# define automatic contour shading
shading = mv.mcont(
    contour_automatic_setting = "ecmwf",
    legend = "on"
    )

# define coastlines
coastlines = mv.mcoast(
    map_coastline_colour    = "cream",
    map_coastline_thickness = 2,
    map_grid_line_style     = "dot",
    map_grid_colour         = "cream"
    )

# define map projection
view = mv.geoview(
    map_projection         = "geos",
    map_vertical_longitude = -20,
    subpage_x_position     = 20,
    subpage_y_position     = 3,
    subpage_x_length       = 86,
    subpage_y_length       = 86,
    coastlines             = coastlines
    )

# define legend
legend = mv.mlegend(
    legend_text_font_size  = 0.25,
    legend_label_frequency = 3
    )

# define title
title = mv.mtext(text_font_size = 0.4)

# define the output plot file
mv.setoutput(mv.pdf_output(output_name = 'simulated_sat_img'))

# generate plot
mv.plot(view, g, shading, legend, title)