-
Created by
 Iain Russell, last updated on Jul 30, 2020
2 minute read
Iain Russell, last updated on Jul 30, 2020
2 minute read

This is the visual definition icon responsible for specifying how symbols (e.g. circles and crosses) are displayed. This can be used with non-gridded data, such as geopoints or CSV.
From Macro/Python this icon can be called as msymb().
Gallery Examples using the Symbol Plotting icon
|
|
|
 |  |


The Symbol Plotting Editor
All of the parameters in this editor come directly from Magics, and are documented on the symbol plotting reference page
Symbol Marker Table
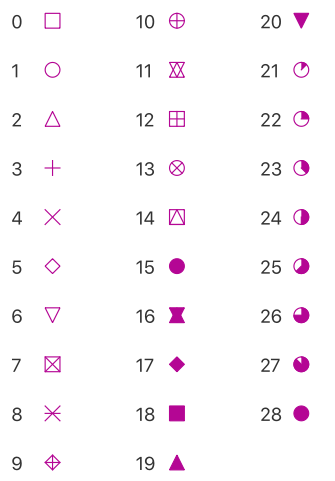
Parameters that take a numeric symbol marker index use the following set of symbols: