...
| Section |
|---|
| Column |
|---|
| | Info |
|---|
|
subpage_lower_left_longitude | | subpage_lower_left_latitude | | subpage_upper_right_longitude | | subpage_upper_right_latitude |
|
| Code Block |
|---|
| theme | Confluence |
|---|
| language | python |
|---|
| title | Python - Setting a projection |
|---|
| collapse | true |
|---|
| from Magics.macro import *
#setting the output
output = output(
output_formats = ['png'],
output_name = "map_step1",
output_name_first_page_number = "off"
)
#settings of the geographical area
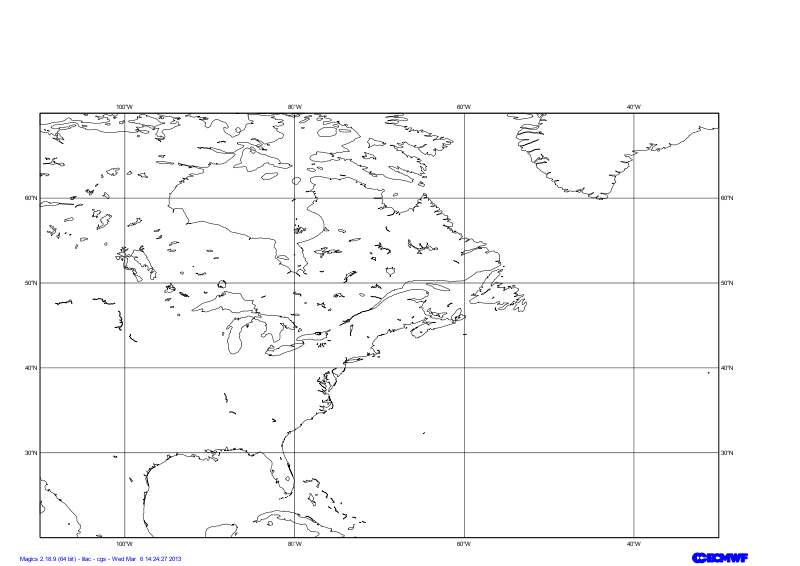
area = mmap(subpage_map_projection="cylindrical",
subpage_lower_left_longitude=-110.,
subpage_lower_left_latitude=20.,
subpage_upper_right_longitude=-30.,
subpage_upper_right_latitude=70.,
)
#Using a default coastlines to see the result
plot(output, area, mcoast()) |
|
| Column |
|---|
| 
|
|
...
| Section |
|---|
| Column |
|---|
| | Info |
|---|
|
map_coastline_land_shade | | map_coastline_land_shade_colour | | map_coastline_colour | | map_grid_colour | | map_grid_line_style |
|
| Code Block |
|---|
| theme | Confluence |
|---|
| language | python |
|---|
| title | Python - Coastlines |
|---|
| collapse | true |
|---|
| from Magics.macro import *
#setting the output
output = output(
output_formats = ['png'],
output_name = "map_step2",
output_name_first_page_number = "off"
)
#settings of the geographical area
area = mmap(subpage_map_projection="cylindrical",
subpage_lower_left_longitude=-110.,
subpage_lower_left_latitude=20.,
subpage_upper_right_longitude=-30.,
subpage_upper_right_latitude=70.,
)
#settings of the caostlines
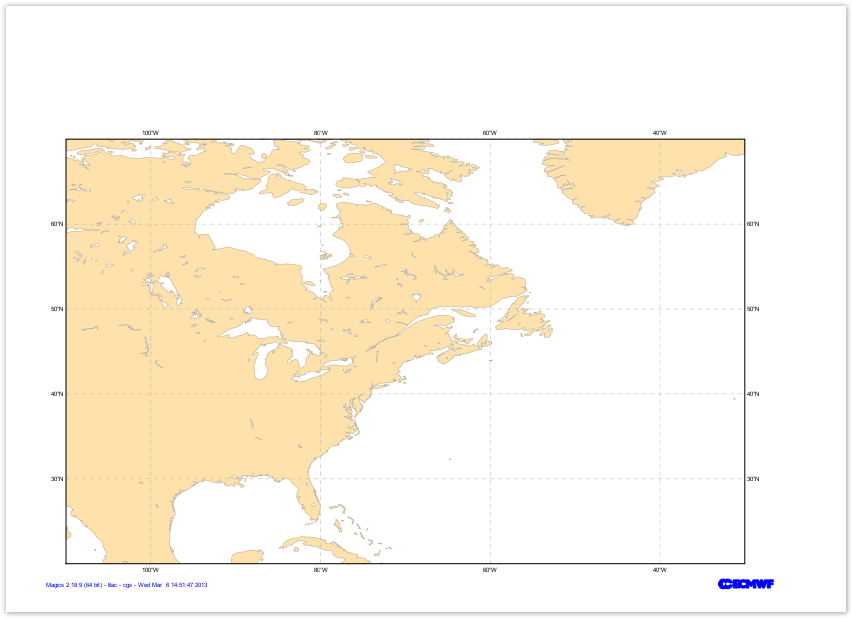
coast = mcoast(map_coastline_land_shade = "on",
map_coastline_land_shade_colour = "cream",
map_grid_line_style = "dash",
map_grid_colour = "grey",
map_label = "on",
map_coastline_colour = "grey")
plot(output, area, coast) |
|
| Column |
|---|
|  |
|
...
The visualisation of any data in Magics is done by combining 2 kind of objects. One, the Data Action, is used to define the data and explain to Magics how to interpret it, the other one is called Visual Action and will define the rules for visualisation. type of visualisation and its attributes.
In this example our data are in a grib file msl.grib. The Data Action to be used is mgrib in is documented in Grib Input Documentation.
The Visualisation we want to apply is a basic contouring, using black for the lines and an interval of 5 hPa, between isolines. We also want to add a automatic legend, with our own text "Mean Sea Level Pressure". Follow the link to access the Contouring Documentation. defined
| Section |
|---|
| Column |
|---|
| | Info |
|---|
|
mgrib action to load the data |
|---|
| grib_input_file_name |
contour_highlight_colour= "black", contour_highlight_thickness= 4, contour_hilo= "off", contour_interval= 5., contour_label= "on", contour_label_frequency= 2, contour_label_height= 0.4, contour_level_selection_type= "interval", contour_line_colour= "black", contour_line_thickness= 2, legend='on', contour_legend_text= "Mean Sea Level Pressure", | mcont action to define a contouring |
|---|
| contour_line_colour | | contour_line_thickness | | contour_highlight_colour | | contour_highlight_thickness | | contour_hilo | | contour_level_selection_type | | contour_interval | | legend | | contour_legend_text | map_coastline_land_shade | | map_coastline_land_shade_colour | | map_coastline_colour | | map_grid_colour | | map_grid_line_style |
|
| Code Block |
|---|
| theme | Confluence |
|---|
| language | python |
|---|
| title | Python - Coastlines |
|---|
| collapse | true |
|---|
| from Magics.macro import *
#setting the output
output = output(
output_formats = ['png'],
output_name = "map_step2",
output_name_first_page_number = "off"
)
#settings of the geographical area
area = mmap(subpage_map_projection="cylindrical",
subpage_lower_left_longitude=-110.,
subpage_lower_left_latitude=20.,
subpage_upper_right_longitude=-30.,
subpage_upper_right_latitude=70.,
)
#settings of the caostlines
coast = mcoast(map_coastline_land_shade = "on",
map_coastline_land_shade_colour = "cream",
map_grid_line_style = "dash",
map_grid_colour = "grey",
map_label = "on",
map_coastline_colour = "grey")
plot(output, area, coast) |
|
| Column |
|---|
|  |
|
...