...
| Section |
|---|
| Column |
|---|
| | Info |
|---|
|
| Useful axis parameters |
|---|
subpage_map_projection | | subpage_x_ axis_type subpage_y_ | | axis_type | subpagetick_ | xlabel_ | min_latitudeheight | subpage | axis_ | xtick_ | minlabel_ | longitudecolour | | subpage_x_max_latitude | | subpage_x_max_longitude | | subpage_y_min | | subpage_y_max | | axis_grid | | axis_title |
|
| Code Block |
|---|
| theme | Confluence |
|---|
| language | python |
|---|
| title | Python - Setting a projection |
|---|
| collapse | true |
|---|
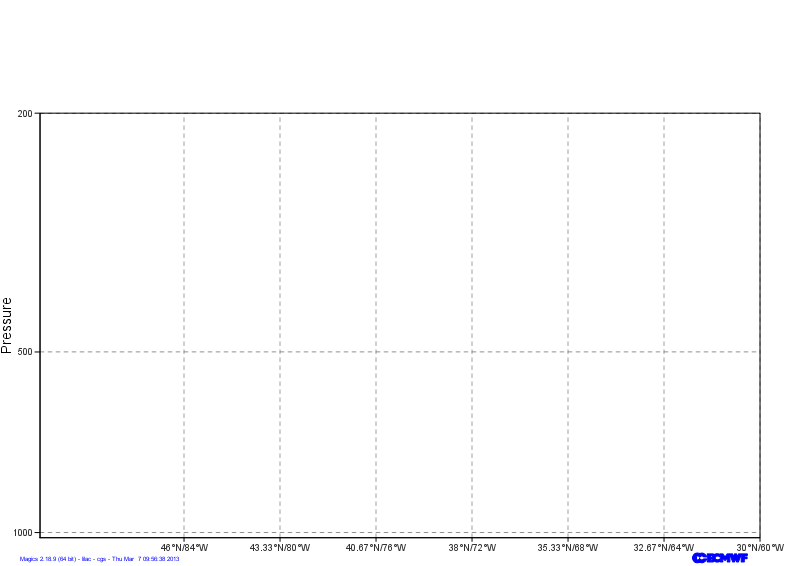
| from Magics.macro import *
#setting the output
output = output(
output_formats = ['png'],
output_name = "xsect_step2",
output_name_first_page_number = "off"
)
# Setting the cartesian view
projection = mmap(
subpage_map_projection='cartesian',
subpage_x_axis_type='geoline',
subpage_y_axis_type='logarithmic',
subpage_x_min_latitude=50.,
subpage_x_max_latitude=30.,
subpage_x_min_longitude=-90.,
subpage_x_max_longitude=-60.,
subpage_y_min=1020.,
subpage_y_max=200.,
)
# Vertical axis
vertical = maxis(
axis_orientation='vertical',
axis_grid='on',
axis_type='logarithmic',
axis_tick_label_height=0.4,
axis_tick_label_colour='charcoal',
axis_grid_colour='charcoal',
axis_grid_thickness=1,
axis_grid_reference_line_style='solid',
axis_grid_reference_thickness=1,
axis_grid_line_style='dash',
axis_title='on',
axis_title_text='Pressure',
axis_title_height=0.6,
)
# Horizontal axis
horizontal = maxis(
axis_orientation='horizontal',
axis_type='geoline',
axis_tick_label_height=0.4,
axis_tick_label_colour='charcoal',
axis_grid='on',
axis_grid_colour='charcoal',
axis_grid_thickness=1,
axis_grid_line_style='dash',
)
plot(output, projection, horizontal, vertical) |
|
| Column |
|---|
| 
|
|
Loading the NetCDF data
In this exercise, we want to visualise a matrix stored in a Netdef file. Netcdf is a very generic format, and can contain a lot of data.
Go to the next step...
...
The user needs to set up some information in order to explain to Magics which variable to plot, and how to interpret it.
To do that, the mnetcdf defines a parameter list that can be found in the Netcdf Input Page.
Now, tet's see what is inside our Netcdf Data
| Code Block |
|---|
|
netcdf section {
dimensions:
        levels = 85 ;
        longitude = 144 ;
        latitude = 144 ;
        p15220121030000000000001_1 = 2 ;
        p15220121030000000000001_2 = 144 ;
        orography_x_values = 144 ;
        orography_y1_values = 144 ;
        orography_y2_values = 144 ;
variables:
        double levels(levels) ;
        double longitude(longitude) ;
        double latitude(latitude) ;
double p13820121030000000000001(levels, longitude) ; |
We want to display the variable p1382012103000000000000, and inform Magics that the dimensions of th ematrix are described in the 2 variables levels and longitude.
We will then just apply a basic contouring.