Objectives
- Set-up a cartesian projection for the Cross section
- Configure the axis
- Load a Netcdf file, and understand the information needed by Magics.
- Apply a shading
- Position the legend box
- Add a text.
You will need to download
- The Xsection Netcdf Data
- and later
 ... the full solution
Setting of the cartesian projection
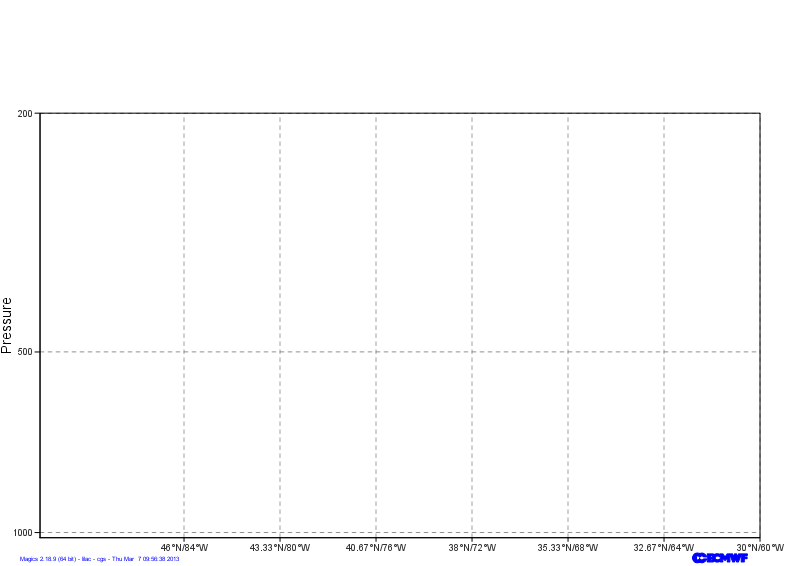
We want to show our Cross section in the following cartesian system:
- The vertical coordinate system is a logarithmic axis from 1000 hPa to 200 hPa.
- The horizontal coordinate system is a geoline axis from [50oN, 90oE] to [30oN, 60oE]
Have a look at the subpage documentation to learn how to setup a cartesian projection .
We just have to add 2 axis (1 vertical, 1 horizontal ) to materialise it on the plot. For backward compatibility, we have only one maxis object, the orientation is defined using the parameter axis_orientation.
Parameters to check
| Useful subpage parameters |
|---|
subpage_map_projection |
| subpage_x_axis_type |
| subpage_y_axis_type |
| subpage_x_min_latitude |
| subpage_x_min_longitude |
| subpage_x_max_latitude |
| subpage_x_max_longitude |
| subpage_y_min |
| subpage_y_max |
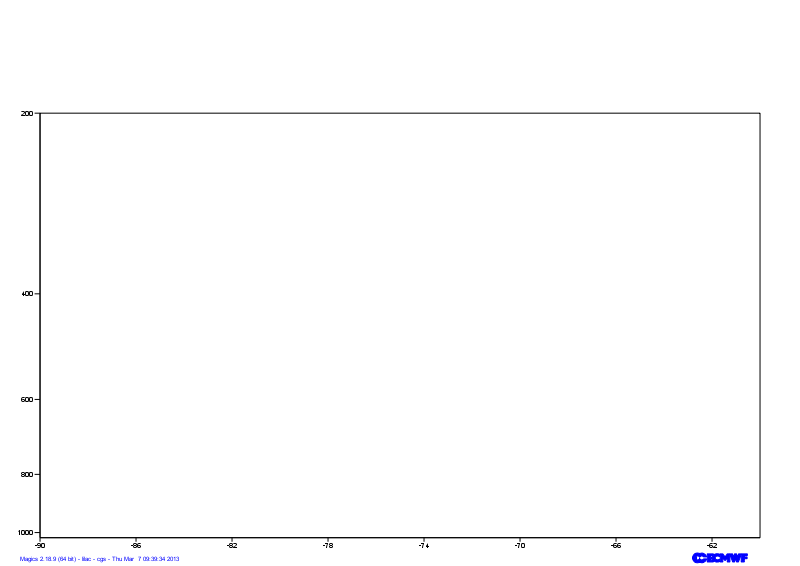
Adjusting the axis
By specialising the axis, you can improve your axis visualisation.
Have a look at the Axis Documentation to browse the possibilities.
Now, try to improve the readability of the line by specialising the horizontal axis.
Parameters to check
| Useful axis parameters |
|---|
subpage_map_projection |
| subpage_x_axis_type |
| subpage_y_axis_type |
| subpage_x_min_latitude |
| subpage_x_min_longitude |
| subpage_x_max_latitude |
| subpage_x_max_longitude |
| subpage_y_min |
| subpage_y_max |