...
Computing a Forecast - Observation Difference
This time we'll compare two very different data types: gridded forecast data in a GRIB file, with scattered observation data described in a BUFR file. We will use the t2m_forecast.grib icon (the gridded forecast data), and the observation data is in a BUFR file represented by the obs.bufr icon and contains observations over Europe, valid at the same time as the GRIB data. Examine and visualise both icons to confirm what they contain.
...
Create a new Observation Filter icon and rename it to filter_obs_t2m.
| Data | Drop the obs.bufr icon here |
| Output | Geographical Points |
| Parameter | 012004 |
Note that 012004 is the code for 'Dry bulb temperature at 2m'. Confirm that the result of this icon's filtering is a set of geopoints with temperature values.
...
This is just the same as before, using a Simple Formula icon; create a new one and rename it to fc_obs_diff. Drop t2m_forecast.grib into the Parameter 1 box, and filter_obs_t2m into the Parameter 2 box. Notice how we are chaining together a sequence of icons - the output of the Observation Filter icon is an input to the Simple Formula icon. Any number of icons can be chained together like this.
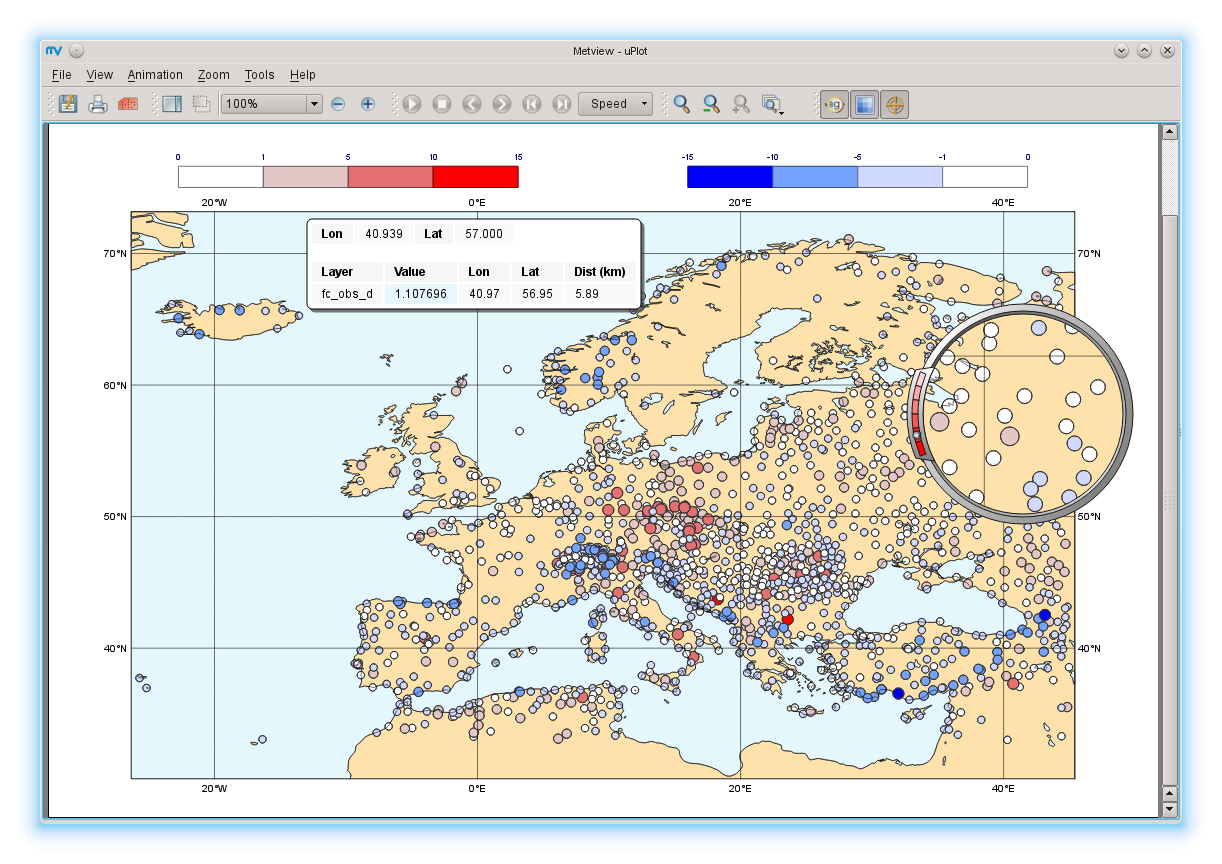
Visualise the result - you will see that the result of a field minus a scattered geopoints data set is another geopoints data set. For each geopoint location, the interpolated value from the field was extracted before performing the computation. From the solutions folder, drop both the diff_symb_hot and the diff_symb_cold icons together into the plot in order to get a more graphical representation of the result.XXXXX
Putting it into a Macro
As with the previous exercise, create a macro which will run all of these steps and plot the result. We could do it using the Generate Macro button from the Display Window, but this time we will do it another way. Create a new Macro icon, rename it to plot_fc_obs_diffs and edit it. Drop the fc_obs_diff icon into the Macro editor - the whole chain of icons which act as input to this one are included in the generated code. Drop also diff_symb_hot and diff_symb_cold into the editor and add a plot() command:
...
Computing Wind Speed from U/V
...