Case description
In this exercise we will use Metview to explore the ways ensemble forecast can be processed and visualised. The case we will investigate is related to a low pressure system crossing the UK on 10 August 2014: it caused high winds and heavy rain especially in the South-Western part of the country. The system has picked up moisture and energy left over from Hurricane Bertha on the other side of the Atlantic.
The plots we want to produce with Metview are as follows:
 | |
 |
The first three plots show the precipitation forecast for the period of August 24 00UTC - 25 00UTC from various model runs preceding the event by 1, 3 and 5 days, respectively. The last plot shows the observed rainfall for the same period.
...
Part 1: Evaluating the forecasts
In this part we will generate ...of the exercise we will create the plot shown below:

Each map contains the forecasts for the 10 m wind gust in a 6-hour period from various model runs:
- top left: the closest forecast to the event
- top right: the forecast run 4 days before the event
- bottom left: the ensemble mean for the ENS forecast run 4 days before the event
- bottom right: the ensemble spread for the ENS forecasts run 4 days before the event
Defining the layout
With a new Display Window icon define a 2x2 layout so that each plot should contain your view.
...
The GRIB file fc_pf.grib contains the 50 perturbed and 1 control forecast member of the ENS (Ensemble Prediction System) run at 7 August 00 TC (four days before the event). We will compute and visualise the mean of the ensemble members to see how the ENS predicted the event. The computations will be done in Macro.
...
Next, add this piece of code for to define the loop (we store the time steps in a list).:
...
Within the loop, first, read all the 50 51 members for the given time step
...
then compute their mean with the mean() macro function
| Code Block |
|---|
f = mean(f) |
and We add it this field to the resulting fieldset:
...
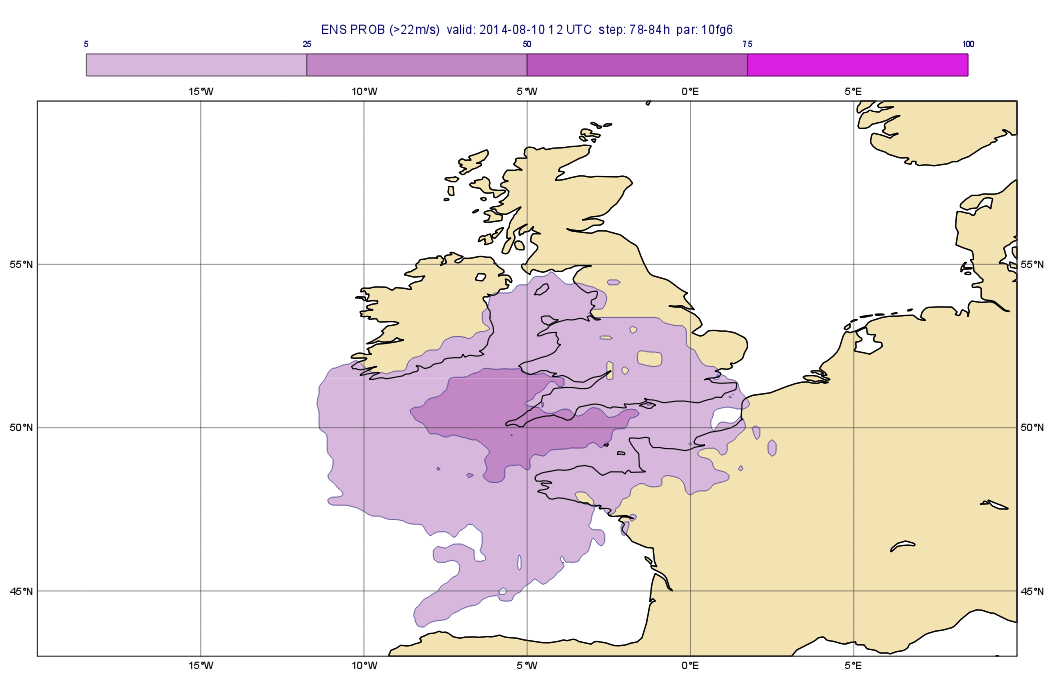
In this part we will estimate the risk of the wind gust being higher than certain thresholds: i.e. we will compute some probabilities. We will write a macro to compute the probability of the wind gust exceeding 20 22 m/s,
So create a Macro and edit it. First, read the GRIB file with the perturbed forecasts in:
...
Next, we define the threshold for wind gust (in m/s units). We will store it in a variable:
| Code Block |
|---|
val=2022 |
Now we can process the fields in a loop going through the time steps:
...