...
Metview has much functionality for meteorological data types stored in ECMWF's MARS archive, for example GRIB, BUFR and ODB. But not all data comes in these formats. Therefore Metview has facilities to handle various other data types, which we will explore here.
XXXX Download data.
Visualiser Icons
Some formats, such as GRIB, are easy to visualise in Metview - just right-click, Visualise. This is because they are quite constrained in their contents and have enough standardised meta-data for a program to understand how they should be plotted. Some other formats, such as netCDF and tables of ASCII data are not easily interpreted for automatic plotting (which variables/columns should be selected and what do they represent?). Metview introduces the concept of the Visualiser icon, which we will use in some of the following examples.
...
NetCDF is a binary file format for storing multi-dimensional arrays of data and has enjoys wide academic usage.
...
Save the changes, and visualise this new icon. See how the settings in the visualiser icon correspond to the variable names in the data. Now visualise another field from the same file. Use the supplied shading_20_levels icon on the plots.
Geopoints
Format overview
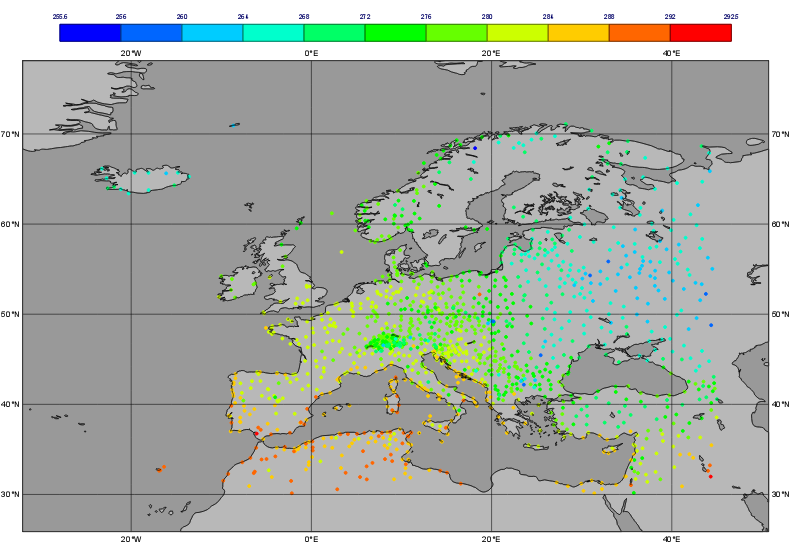
Geopoints is the ASCII format used by Metview to handle spatially irregular data (e.g. observations). There are a number of variations on the format, but the default one is a 6-column layout. The columns do not have to be aligned, but there must be at least one whitespace character between each entry.
...
Visualise the icon. The visdef used for geopoints is Symbol Plotting, and its default behaviour is to plot the actual numbers on the map. This can become cluttered, and text rendering can be slow. Drop the supplied symb_colours icon into the Display Window to get a better view of the data (you can also edit symb_colours to see which parameters were set to achieve this effect.
Computing some statistics in Macro
...
The distance() function returns a new geopoints variable based on its input geopointgeopoints, where each point's value has been replaced by the distance of that point from the given location. The description of this function follows:
...
Choose a location and use this function to compute the distances of the data points from it. Assign the result to a variable called distances and return it to the user interface to examine the numbers. The distances are in metres.
Now we will see a boolean operator in action. The expression distances < 100000 (one hundred thousand) will return a new geopoints variable where, for each point, if the input value was less than 100000, the resulting value will be 1; otherwise the resulting value will be zero. So the resulting geopoints will have a collection of ones and zeros. Confirm that this is the case.
...
Converting between geopoints and GRIB
? Needed? Already This has already been covered in the Processing Data part! XXXXXX Data Part 1.
Other ASCII Data
ASCII Table Data
...
First, use the values() function to extract arrays of lats, lons and T2m from the CSV data. These will be returned in variables of type vector - this is an in-memory array of double-precision numbers.
...