...
The coordinate system is defined by the Cartesian View icon, the visual appearance of the axes by the Axis Plotting icons and the title by the Text Plotting icon. The data points themselves can be modified with the Symbol Plotting (for points) and Graph Plotting (for lines) icons.
XXXX download data
A Simple Graph
XXXXXXX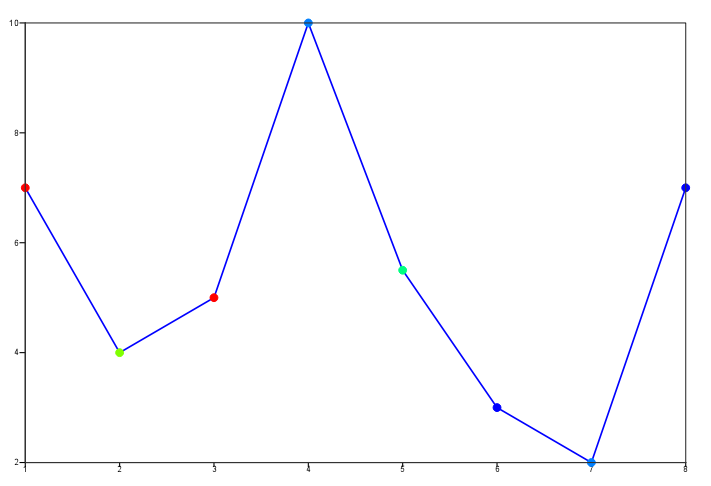
Create a new Input Visualiser icon. Set Input Plot Type to XYPoints and type a list of values (forward slash-delimited) for both Input X Values and Input Y Values (they should have the same number of elements).
...