...
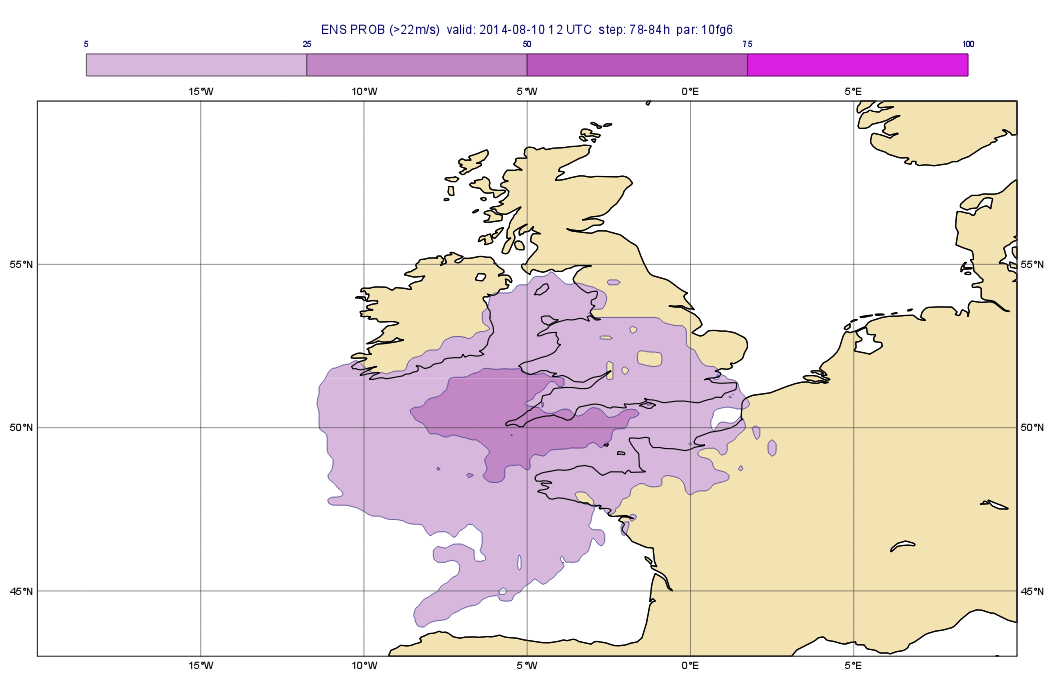
In this part we will estimate the risk of the wind gust being higher than a certain threshold. We will compute the probability of the wind gust exceeding 22 m/s (about 80 k/m) and generate the plot shown below:
We can will compute the probabilities with a Macro in a very similar way as we did for the ensemble mean (and standard deviation). The difference is that this time we need to compute a probability for each time step:.
Now duplicate the ensemble mean Macro and replace the computation edit. Find the line computing the mean and replace it with this code block:
| Code Block |
|---|
f=f > 22 f=100*mean(f) |
The first line of the our computations performs a logical operation on the fieldset and results in a new fieldset. In this new fieldset we have only 1s and 0s:
- the value is 1 in each gridpoint where the condition meets (i.e. the value is larger than the threshold)
- the value is 0 in all other gridpoints.
The second line is simply deriving derives the probability as the mean of these fields. We multiply the result by 100 to scale it into the 0-100 range for an easier interpretation.
...