...
In this exercise we will build a WMS GetMap request for a Sea Surface Temperature layer from the NASA Earth Observations WMS server and visualise the resulting image in Metview.
The WMS Client Icon
WMS requests in Metview can be defined and executed by the WMS Client icon. You can find this icon in the icon drawer.
...

Create a new WMS Client icon in your ‘wms_tutorial’ folder (by dragging it into the folder). Rename it ‘NASA’ and open its editor (double-click or right-click,
...

Loading GetCapabilities
Type in the following web address into the URL bar at the top of the interface:
http://neowms.sci.gsfc.nasa.gov/wms/wms
Loading GetCapabilities
Type in the following web address into the URL bar at the top of the interface:
http://neowms.sci.gsfc.nasa.gov/wms/wms
Now we will send the GetCapabilities request to this server by clicking on the button in the toolbar (hitting enter Now we will send the GetCapabilities request to this server by clicking on the button in the toolbar (hitting enter in the URL bar results in the same action).

This operation can take This operation can take a while depending on the network traffic and the server load. If the server does not seem to reply the request can be interrupted any time by clicking on the button in the toolbar.

Please note that there is a log panel at the bottom of the editor displaying detailed information about the request sent to the server and indicates its status, as well. This panel can be hidden or shown by the toggle button in the toolbar. The statusbar, at the bottom of the interface, briefly indicates the status of the current operation.
If the GetCapabilities request was successful the editor is populated with the replied data.
bottom of the interface, briefly indicates the status of the current operation.

If the GetCapabilities request was successful the editor is populated with the replied data.

The WMS client analyses the returned GetCapabilities document and displays the layers ( tab) and supported file formats ( combo box in the toolbar) on the left hand side. Formats that cannot be visualised in Metview are greyed out in the list.
The complete GetCapabilities document is shown on the right ( tab. This is intended for more expert users and can be used to debug GetCapabilities documents. The service provider’s meta-data ( tab) is also displayed on the right hand side.
...
Selecting a Layer
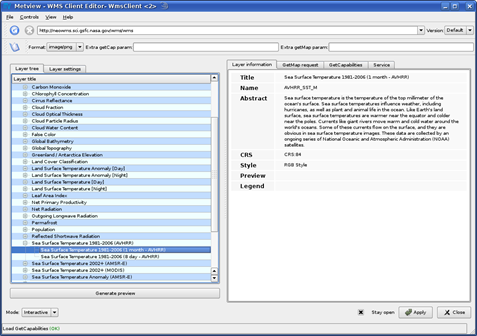
Now browse the layer tree on the left hand side and select the sub-layer called
Sea Surface Temperature 1981-2006 (1 month - AVHRR)
...
Then switch to the tab on the right hand side of the editor. This tab shows the properties of the selected layer. At first what you can see here is the meta-data:
...
...
- Title: Each layer has a mandatory title. It provides a short description about the layer.
...
- Name: It is an identifier to be used in the GetMap request. If a layer has a name it can appear in a GetMap request and a map image can be generated for it. If a name is not available the layer is only a container layer for other (sub) layers.
...
- Abstract: If it is available it provides detailed information about the layer content.
...
...
- Logo: if a logo is available for the layer it is displayed here.
...
...
On top of the meta-data various user-configurable map image generation parameters are shown here:
...
- CRS/SRS: It stands for Coordinate Reference System (for WMS version 1.3.0 or later) or Spatial Reference System (older WMS versions). Each layer can offer an arbitrary number of reference systems. Metview currently supports the CRS:84 and EPSG:4326 reference systems. Both stand for the lat-lon or plate-carrée projection. Please note that a bounding box is associated for each CRS/SRS in a given layer. However, this bounding box is not editable in the WMS Client editor, instead Metview will adjust it automatically for the needs of visualisation.
...
...
- Style: It specifies the visual style for the map image generation. Each layer can contain an arbitrary number of styles (even none).
Setting the Layer Properties
...
...
Now we will specify the date and time for our Sea Surface Temperature layer. Click on the tab on left hand side of the editor. This shows the user-settable layer properties. We already know CRS and Style from the previous step. On top of these we can see Time here. If we click on the extension button next to the label the available values will be listed.
...