...
Now we will specify the date and time for our Sea Surface Temperature layer. Click on the tab on left hand side of the editor. This shows the user-settable layer properties. We already know CRS and Style from the previous step. On top of these we can see Time here. If we click on the extension button next to the label the available values will be listed.

Time is a predefined dimension in the WMS standards. Dimensions are optional layer properties and we will see how to work with them in Part 3 of this tutorial. At present it is enough to select the default value by clicking on item Default in the list.

Generating a Preview
Having specified the time we can generate a preview for the selected layer. Click on the button in the layer tab. Now Metview builds and sends a GetMap request to the server to acquire a map image for the layer using the specified CRS, style and time.
At the same time another request is sent to the server to generate a legend image for the given style (if it is available). Just like in the case of the GetCapabilities request, the requests sent to the server can be seen in the log panel area. When the server replies for these requests the resulting images are displayed in the tab.
Please note that the WMS client always uses the maximum bounding box of the given CRS to generate the preview image.
Checking the GetMap Request
One of the main purposes of the WMS client editor is to automatically generate a GetMap request that, in the end, can be visualised in Metview. This GetMap request is kept continuously updated as we change our layer settings in the interface. To see this request just click on the tab in the right hand side of the editor.
Saving the GetMap Request
If we are satisfied with our request we can save it by clicking on the button at the bottom left corner of the editor. With this action the GetMap request we generated together with some meta-data will be stored in our WMS Client icon. Please note that by closing the interface without clicking on we will lose all the settings we have made!
Visualising the WMS client Icon
...
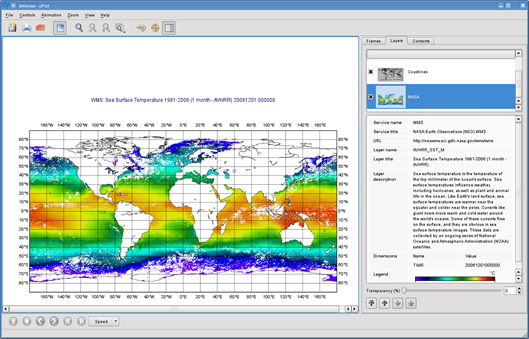
You can see here a similar image to the preview but this time it is overlaid with the Metview coastlines. By clicking on the ‘NASA’ layer in the tab (on the right hand side of the plot window) you will see the meta-data associated with the visualised WMS layer and the legend, as well.
Remarks:
...

At the same time another request is sent to the server to generate a legend image for the given style (if it is available). Just like in the case of the GetCapabilities request, the requests sent to the server can be seen in the log panel area. When the server replies for these requests the resulting images are displayed in the tab.
Please note that the WMS client always uses the maximum bounding box of the given CRS to generate the preview image.
Checking the GetMap Request
One of the main purposes of the WMS client editor is to automatically generate a GetMap request that, in the end, can be visualised in Metview. This GetMap request is kept continuously updated as we change our layer settings in the interface. To see this request just click on the tab in the right hand side of the editor.

Saving the GetMap Request
If we are satisfied with our request we can save it by clicking on the button at the bottom left corner of the editor. With this action the GetMap request we generated together with some meta-data will be stored in our WMS Client icon. Please note that by closing the interface without clicking on we will lose all the settings we have made!
Visualising the WMS client Icon
Save your settings (if you have not done so) then right-click on the icon and select. This will execute the GetMap request and visualise the resulting image in a Metview Display Window.
You can see here a similar image to the preview but this time it is overlaid with the Metview coastlines. By clicking on the ‘NASA’ layer in the tab (on the right hand side of the plot window) you will see the meta-data associated with the visualised WMS layer and the legend, as well.
Remarks:
- When a WMS client icon is visualised the GetCapabilities request is not executed but the meta-data (including the legend URL) stored in the icon is used to populate the tab in the . As mentioned above, the meta-data is written into the icon when we save the settings in the WMS client editor. This means you need to re-edit your icon to update the meta-data if it has been changed on the server in the meantime.
...
...
- Please be aware that WMS services are subject to change and a request that works today might be invalid tomorrow. In this case the WMS client icon should be re-edited to pick up the latest changes. The most typical example is a WMS service providing observations with the Time dimension containing only the most recent dates.
...
- Please note that the WMS images generated by the WMS client icon are not cached in Metview. This means that whenever you visualise a WMS client icon its GetMap request is always executed. However, there is an ongoing work to implement WMS image caching and it will be available in future Metview releases.
...
...
Overlaying a WMS Map Image with
...
Other Data
To overlay a WMS map image with any other data just drag the icons representing the data into the plot. There are two icons prepared for you in the folder to try this out: the ‘coastlines_grey’ Coastlines icon and the ‘mslp’ GRIB icon. Simply drag them into the Display Window and see how the plot has been changed.
...

Part 3 – Generating a Series of Map Images
...
In the previous exercise we selected only one date for our Sea Surface Temperature layer. Now we will take a step forward and select multiple dates to generate a series of map images that can be visualised as an animation in Metview. We will continue to work in folder ‘wms_tutorial’.
...
WMS Dimensions
...
...
The generation of multiple map images relies on the concept of WMS dimensions. Dimensions are optional layer attributes allowing the specification of date, time, elevation and other custom parameters. There are two predefined dimensions in the WMS standards: Time and Elevation. On top of these, layers can have other custom dimensions each starting with a DIM_ prefix (e.g. DIM_RUN, DIM_FORECAST).
...
Dimensions have a special role for the Metview WMS client: if multiple values are selected for a given dimension the client will generate a separate GetMap request, and thus, a separate map image for each of them. The result is a series of map images defining the animation frames for Metview.
Defining Multiple Dates
...
...
Duplicate your ‘NASA’ WMS Client icon and rename the duplicate ‘NASA loop’. Edit it and select the tab on the left hand side. This panel lists all the dimensions of the selected layer. Here we can only see dimension Time because only this dimension is defined for the layer. Now click on the extension button next to the Time label to see all the possible values. What you can see here is as follows (apart from the default value):
...
1981-09-01/2006-12-01/P1M
...
This expression defines a range of time values based on a special encoding (this is the extension of the ISO8601 standard). This expression reads as: dates from 1981-09-01 to 2006-12-01 by a one month step.
...
.
Now we will specify every month in 2006 to generate twelve map images for our animation. First we need to clear the current selection (by clicking on the clear button to the right of the text input area) and then type in the following text:
2006-01-01/2006-01-12/P1M
...
Having done this the interface should look like as follows:

As mentioned above, by specifying twelve dates we generated twelve individual GetMap requests. To inspect these requests click on the tab in the right hand side of the editor.

We can see here that the requests are almost identical and the only difference is that Time is varying from one request to the other. Please note that for the sake of better readability the dimensions (in our case it is only Time) are always highlighted in a different colour (orange) to the other parameters in this list.
...
Visualising the Results
...
...
Save your settings (if you have not done so) then right-click on the icon and select. This will execute all the GetMap requests and visualise the resulting images in a Metview Display Window.
...
The plot looks like much the same as in Part 2 but since we have more than one image we can navigate through them by using the animation buttons in the toolbar or the in tab (on the right hand side of the window).
Customising the Frames Tab
...
...
The list in the tab shows you the values of a set of meta-data keys for each animation frame (i.e. for each image). To see the key names just put the cursor into the column headings. The keys used here are basically GRIB API keys but WMS parameters are mapped to them (see the table below for details).
...