This tutorial explains how to use the WMS (Web Map Service) client within Metview 4.
| Note | ||
|---|---|---|
| ||
Please note that this tutorial requires Metview version 4.4.3 or later. |
| Table of Contents |
|---|
Preparations
First start Metview; at ECMWF, the command to use is metview_new (see Metview at ECMWF for details of Metview versions). You should see the main Metview desktop popping up.
You will create some icons yourself, but some are supplied for you - please download the following file:
| Panel | ||
|---|---|---|
| ||
Alternatively, if at ECMWF then you can copy it like this from the command line: |
and save it in your $HOME/metview directory. You should see it appear on your main Metview desktop, from where you can right-click on it, then choose execute to extract the files. You should now (after a few seconds) see a wms_tutorial folder which contains the solutions and also some additional icons required by these exercises. You will work in the wms_tutorial folder so open it up. You should see the following contents
| Table of Contents |
|---|
Preparations
Before you start the tutorial you need to execute the following preparatory steps:
Start Metview 4 with your local command. At the ECMWF you can do it by typing the following command in a terminal window:
| Code Block |
|---|
metview -slog & |
...
:

Please note that because the WMS client requires internet access you might need to configure your network proxy settings in Metview. This can be done by selecting ‘Preferences’ from the menu in the toolbar of the Metview Desktop.
...
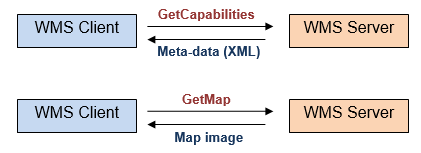
- GetCapabilities: the server sends back information about the WMS meta-data and the available map layers (typically in XML format).
- GetMap: based on the specified parameters in the request (e.g. bounding box, geographic coordinate reference system, image size and format etc.), the server returns a map image for a selected layer that can be now visualised by the client.
The Metview WMS client can perform both of this these request types enabling users to perform the following actions:
...
WMS requests in Metview can be defined and executed by the WMS Client icon. You can find this icon in the icon drawer.

Create a new WMS Client icon in your ‘wms_tutorial’ folder (by dragging it into the folder). Rename it ‘NASA’ and open its editor (double-click or right-click,

Loading GetCapabilities
...
Now we will send the GetCapabilities request to this server by clicking on the button in the toolbar (hitting enter in the URL bar results in the same action).

This operation can take a while depending on the network traffic and the server load. If the server does not seem to reply the request can be interrupted any time by clicking on the button in the toolbar.

Please note that there is a log panel at the bottom of the editor displaying detailed information about the request sent to the server and indicates its status, as well. This panel can be hidden or shown by the toggle button in the toolbar. The statusbar, at the bottom of the interface, briefly indicates the status of the current operation.

If the GetCapabilities request was successful the editor is populated with the replied data.

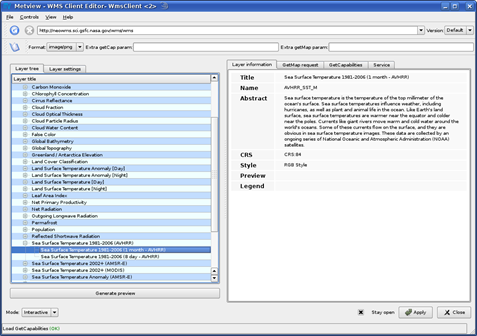
The WMS client analyses the returned GetCapabilities document and displays the layers ( tab) and supported file formats ( combo box in the toolbar) on the left hand side. Formats that cannot be visualised in Metview are greyed out in the list.
...
- CRS/SRS: It stands for Coordinate Reference System (for WMS version 1.3.0 or later) or Spatial Reference System (older WMS versions). Each layer can offer an arbitrary number of reference systems. Metview currently supports the CRS:84 and EPSG:4326 reference systems. Both stand for the lat-lon or plate-carrée projection. Please note that a bounding box is associated for each CRS/SRS in a given layer. However, this bounding box is not editable in the WMS Client editor, instead Metview will adjust it automatically for the needs of visualisation.
- Style: It specifies the visual style for the map image generation. Each layer can contain an arbitrary number of styles (even none).
Setting the Layer Properties
Now we will specify the date and time for our Sea Surface Temperature layer. Click on the tab on left hand side of the editor. This shows the user-settable layer properties. We already know CRS and Style from the previous step. On top of these we can see Time here. If we click on the extension button next to the label the available values will be listed.

Time is a predefined dimension in the WMS standards. Dimensions are optional layer properties and we will see how to work with them in Part 3 of this tutorial. At present it is enough to select the default value by clicking on item Default in the list.

Generating a Preview
Having specified the time we can generate a preview for the selected layer. Click on the button in the layer tab. Now Metview builds and sends a GetMap request to the server to acquire a map image for the layer using the specified CRS, style and time.

At the same time another request is sent to the server to generate a legend image for the given style (if it is available). Just like in the case of the GetCapabilities request, the requests sent to the server can be seen in the log panel area. When the server replies for these requests the resulting images are displayed in the tab.
...
One of the main purposes of the WMS client editor is to automatically generate a GetMap request that, in the end, can be visualised in Metview. This GetMap request is kept continuously updated as we change our layer settings in the interface. To see this request just click on the tab in the right hand side of the editor.

Saving the GetMap Request
...
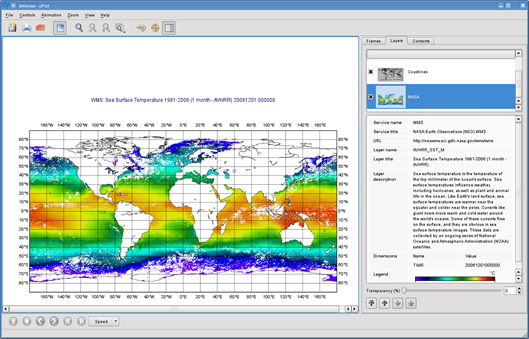
You can see here a similar image to the preview but this time it is overlaid with the Metview coastlines. By clicking on the ‘NASA’ layer in the tab (on the right hand side of the plot window) you will see the meta-data associated with the visualised WMS layer and the legend, as well.
Remarks:
- When a WMS client icon is visualised the GetCapabilities request is not executed but the meta-data (including the legend URL) stored in the icon is used to populate the tab in the . As mentioned above, the meta-data is written into the icon when we save the settings in the WMS client editor. This means you need to re-edit your icon to update the meta-data if it has been changed on the server in the meantime.
- Please be aware that WMS services are subject to change and a request that works today might be invalid tomorrow. In this case the WMS client icon should be re-edited to pick up the latest changes. The most typical example is a WMS service providing observations with the Time dimension containing only the most recent dates.
- Please note that the WMS images generated by the WMS client icon are not cached in Metview. This means that whenever you visualise a WMS client icon its GetMap request is always executed. However, there is an ongoing work to implement WMS image caching and it will be available in future Metview releases.
...
To overlay a WMS map image with any other data just drag the icons representing the data into the plot. There are two icons prepared for you in the folder to try this out: the ‘coastlines_grey’ Coastlines icon and the ‘mslp’ GRIB icon. Simply drag them into the Display Window and see how the plot has been changed.

Generating a Series of Map Images
...
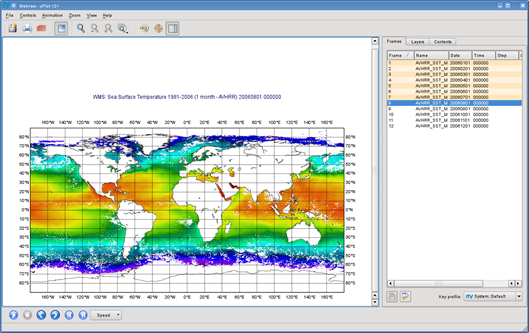
Having done this the interface should look like as follows:

As mentioned above, by specifying twelve dates we generated twelve individual GetMap requests. To inspect these requests click on the tab in the right hand side of the editor.

We can see here that the requests are almost identical and the only difference is that Time is varying from one request to the other. Please note that for the sake of better readability the dimensions (in our case it is only Time) are always highlighted in a different colour (orange) to the other parameters in this list.
...
Frame keys can be grouped into ‘key profiles’. At the bottom of the tab there is a combo box to switch between the existing key profiles. To manage the key profiles (e.g. to add your own profiles) please try the Key profile manager dialog that can be launched by the button with a spanner icon next to the key profile selector combo box.
Remarks:
- As a general rule multiple dimension values can be specified as a comma separated list. This is also true for dimension Time so our time selection could have been written as:
2006-01-01,2006-02-01,2006-03-01,2006-04-01,2006-05-01,2006-06-01,2006-07-01,2006-08-01,2006-09-01,2006-10-01,2006-11-01,2006-12-01
Please note that white spaces are not allowed between the commas and the values! - The following table summarises how the WMS parameters are mapped to frame keys in Metview.
...
In folder ‘wms_tutorial’ duplicate your ‘NASA’ WMS Client icon and rename the duplicate ‘NASA plain’. Edit it and find the combo box in the bottom left corner of the user interface.

Now select option “Plain” from the combo box to enter the plain editing mode. You should see the following user interface:

The editable WMS request parameters are listed on the left hand side of the interface. Whenever you edit a parameter the WMS request displayed on the right hand side of the interface is immediately updated.
...
- In the plain editing mode the GetCapabilities document is not loaded so the client can neither offer the available values for the parameters nor check if the typed-in values are correct at all.
- When you switch from the plain mode to the interactive mode the WMS client always loads the GetCapabilities request and checks each parameter value against the allowed values. It might result in overriding some of your settings defined in the plain editing mode.

Importing WMS Requests
...
Create a new WMS Client icon. Rename it ‘NASA topography’ and open its editor. Select ‘Import’ from the menu in the menu bar to start up the Import dialog. Now open your ‘NASA topography request’ icon’s editor (if you have not done so) then copy and paste the request into the Import dialog.

Having finished it just press the button to populate the WMS client user interface with the request parameters. Now preview the selected layer and visualise it (after saving the settings) then close the editor.
...
The quickest way to generate a macro is to simply save a visualisation on screen as a Macro icon. Visualise your ‘NASA’ WMS Client icon, drop the ‘coaslines_grey’ and ‘mslp’ icons into the plot and click on the macro icon in the tool bar of the Display Window.

Now a new Macro icon called 'MacroFrameworkN' is generated in your folder. Right-click this icon. Now you should see your original plot reproduced.
...