...
In these exercises we will look at a case study of a severe storm using a forecast ensemble. During the course of the exercise, we will explore the scientific rationale for using ensembles, how they are constructed and how ensemble forecasts can be visualised. A key question is how uncertainty from the initial data and the model parametrizations impact the forecast.
You will start by studying the evolution of the ECMWF analyses and forecasts for this event. You will then run your own OpenIFS forecast for a single ensemble member at lower resolutions and work in group to study the OpenIFS ensemble forecasts.
...
| Panel | ||||||||
|---|---|---|---|---|---|---|---|---|
| ||||||||
Please refer to the handout showing the storm tracks labelled 'ens_oper' during this exercise. It is provided for reference and may assist interpreting the plots. Each page shows 4 plots, one for each starting forecast lead time. The position of the symbols is the storm centre valid for 28th Oct 2013 at 12Z. The colour of the symbols is the central pressure. The actual track of the storm from the analysis is show as the red curve with the position at 28th 12Z highlighted as the hour glass symbol. The control forecast for the ensemble is shown as the green curve and square symbol. The lines show the 12hr track of the storm; 6hrs either side of the symbol. |
...
Note there appear to be some forecasts that give a much lower RMS error . We will come back to this in later tasks.than the control forecast.
If time, explore
- Explore the plumes from other variables.
- Do you see the same amount of spread in RMSE from other pressure levels higher in the atmosphere?
Task 2: Ensemble spread
In the previous task, we have seen that introducing some uncertainty into the forecast
Task ??. CDF/RMSE at different locations <<< WHERE DOES THIS FIT???
Recap
...
ens_to_an.mv
If time: use the 'members=' option to change the number of members in the spread plots.
Task 3: Spaghetti plots - another way to visualise spread
Task 4: Visualise ensemble members and difference
Stamp plots.
If time:
- use the stamp plots, identify the 'best' forecasts and use ens_to_an.mv to modify the list of ensembles plots
- use the pf_to_cf_diff macro to take the difference between these perturbed ensemble member forecasts from the control
Task 5: Cumulative distribution function at different locations
Recap
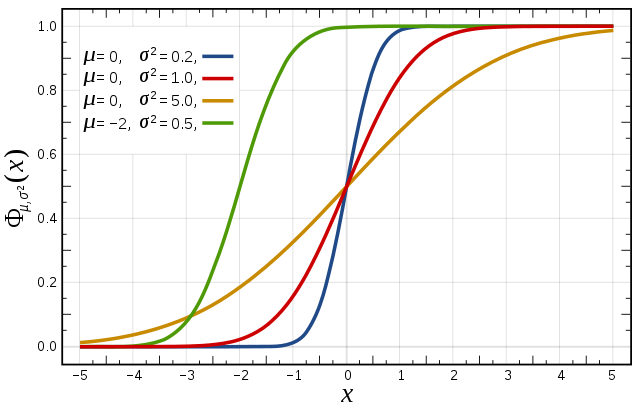
| Cumulative distribution function | Cumulative distribution function for a normal distribution. Figure from Wikipedia |
Objective: Understand ensemble reliability.
...
Exercise 4. Exploring the role of uncertainty using OpenIFS forecasts
To further understand the impact of the different types of uncertainty (initial and model), some experiments with OpenIFS have been
Experiments available:
- EDA+SV+SPPT+SKEB : Includes initial data and model uncertainty (experiment id : gbzl) <<< CHANGE THESE
- EDA+SV only : Includes only initial data uncertainty (experiment id: gc11)
- SPPT+SKEB only : Includes model uncertainty only (run by participants, experiment id: oifs)
...
