...
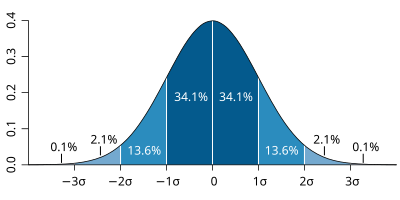
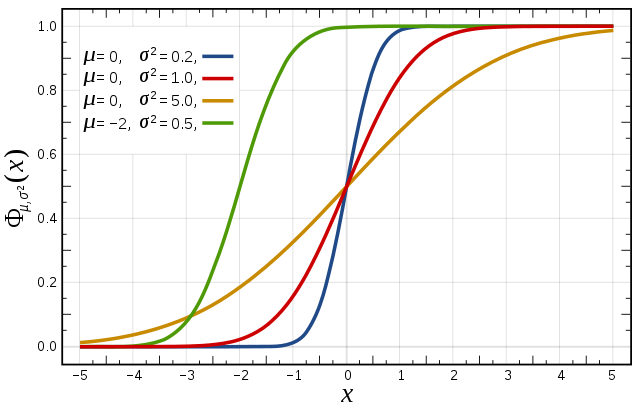
Cumulative distribution function (CDF) The figures to the right illustrate the relationship between a normal distribution and its associated cumulative distribution function.The CDF is constructed from the area under the probability density function along the x-axis. The CDF gives the probability that a value on the curve will be found to have a value less than or equal to the value on the x-axis. Note that the shape of the CDF curve is related to the shape of the normal distribution. The width of the CDF curve is directly related to the value of the standard deviation of the probability distribution function. For our ensemble, the width is then related to the 'ensemble spread'. For a forecast ensemble where all values were the same, the CDF would be a vertical straight line. | The probability distribution function of the normal distribution | Cumulative distribution function for a normal Figure from Wikipedia |
...

