...
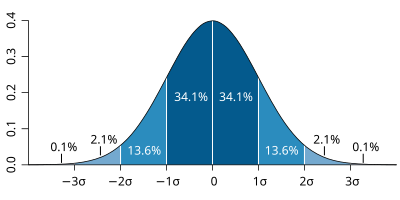
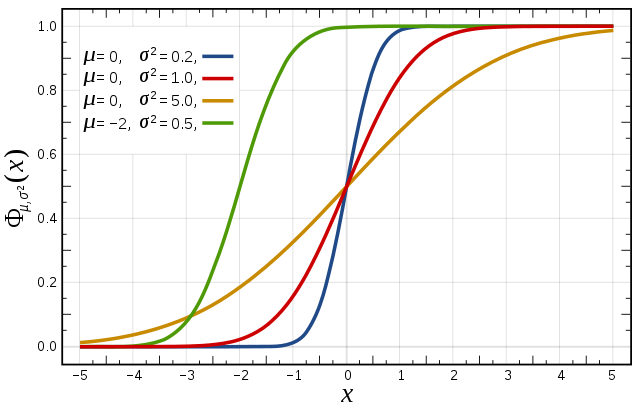
Cumulative distribution function (CDF) The figures to the right illustrate the relationship between a normal distribution and its associated cumulative distribution function.The CDF is constructed from the area under the probability density function. The CDF gives the probability that a value on the curve will be found to have a value less than or equal to the corresponding value on the x-axis. For example, in the figure right, the probability for values less than or equal to X=0 is 50%. The shape of the CDF curve is related to the shape of the normal distribution. The width of the CDF curve is directly related to the value of the standard deviation of the probability distribution function. For our ensemble, the width is then related to the 'ensemble spread'. For a forecast ensemble where all values were the same, the CDF would be a vertical straight line. | The probability distribution function of the normal distribution | Cumulative distribution function for a normal Figure from Wikipedia
|
Objective: Understand ensemble reliability.
TO BE FINISHED
- Choose 3 locations.e.g. Reading, Amsterdam, Copenhagen.
- Using 10m wind and/or wind gust data plot CDF & RMSE curves using one of the OpenIFS forecasts and the ECMWF analysis data.
- What is the difference and why?
- Repeat for one of the other OpenIFS runs. Are there any differences, if so why?
...
| Panel |
|---|
Group A: The Swedish weather centre is interested in giving out useful weather warnings. They want to know the maximum precipitation and wind gusts over Scandinavia and their likelihood (more than XX m/s wind and XX mm precipitation). Would you give out weather warnings and if yes for which days and areas (1 day lead time)? Group B: The organiser of a garden party at Windsor Castle at a particular date needs to prepare for weather. The Queen will join the party and she is not amused if there are too many tents that are not necessary. However, it will take some time to prepare shelters for rain and wind or to cancel the event (two days lead time). Would you prepare for rain? Group C: The operator of a wind farm in the northern see needs to know the highest possible wind speeds to shut down turbines (at XX m/s). If the turbines are shut down too early, power production will be reduced. If they are shut down too late, they will break (6 hours lead time). Would you shut down the wind farm? |
...
Task 6: Creating an ensemble forecast using OpenIFS
See separate handout.
In this exercise, OpenIFS will be run on the ECMWF Cray XC30 to create a forecast for the storm at T319 resolution using only the stochastic schemes in the model. All forecasts are started from the same initial conditions based on the analysis. Aim is to understand the impact of these different methods on the ensembleA ensemble will be created from all the individual runs for the next exercise.
Exercise 4. Exploring the role of uncertainty using OpenIFS forecasts
To further understand the impact of the different types of uncertainty (initial and model), some experiments forecasts with OpenIFS have been
Experiments available:
made in which the uncertainty has been selectively disabled. These experiments use a 40 member ensemble and are at T319 resolution, lower than the operational ensemble.
Experiments available:
- EDA+SV+SPPT+SKEB : Includes initial data (EDA, SV) and model uncertainty (SPPT, SKEB) (experiment id : ens_both)EDA+SV+SPPT+SKEB : Includes initial data and model uncertainty (experiment id : gbzl) <<< CHANGE THESE
- EDA+SV only : Includes only initial data uncertainty (experiment id: gc11 ens_initial)
- SPPT+SKEB only : Includes model uncertainty only (run by participants, experiment id: ens_model)
- SPPT+SKEB only, class ensemble : this is the result of the previous task using the ensemble run by the class (experiment id: oifs)
These are at T319 with start dates: 24/25/26/27 Oct 00Z for 5 days with 3hrly output.
The aim of this exercise is to use the same visualisation and investigation to understand the impact the different types of uncertainty make on the forecast.
Follow the same tasks as above.
Plots:
- as above
- 4 frame: fc-an, fc-fc, pert.fc, ctl-an? *(compare the fc-fc maps with fc-an maps - can we see the uncertainty in the difference?)
- PV maps
...

