...
- Select 'better' forecasts using the stamp plots and use ens_to_an.mv to modify the list of ensembles plots. Can you tell which area is more sensitive in the formation of the storm?
- use the pf_to_cf_diff macro to take the difference between these perturbed ensemble member forecasts from the control to also look at this.
Task 5: Computing the EOFs and clusters
TO BE DONE
...
Task 5: Cumulative distribution function
Recap
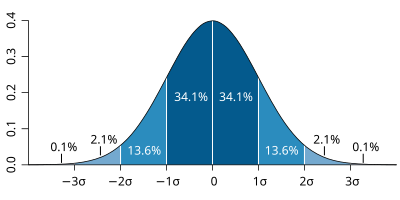
| The probability distribution function of the normal distribution or Gaussian distribution. The probabilities expressed as a percentage for various widths of standard deviations (σ) represent the area under the curve. |
|---|
Figure from Wikipedia. |
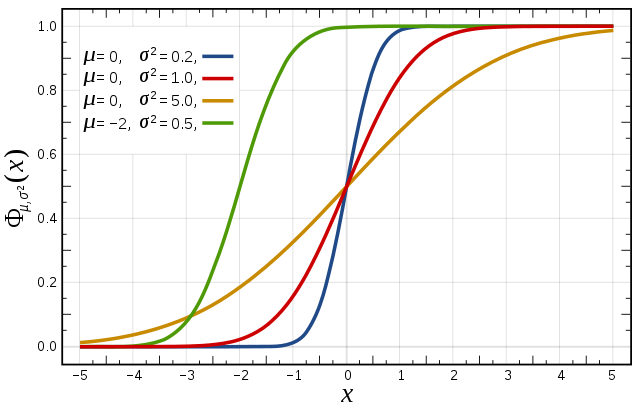
Cumulative distribution function for a normal |
|---|
Figure from Wikipedia. |
Cumulative distribution function (CDF)
The figures above illustrate the relationship between a normal distribution and its associated cumulative distribution function.The CDF is constructed from the area under the probability density function.
The CDF gives the probability that a value on the curve will be found to have a value less than or equal to the corresponding value on the x-axis. For example, in the figure, the probability for values less than or equal to X=0 is 50%.
The shape of the CDF curve is related to the shape of the normal distribution. The width of the CDF curve is directly related to the value of the standard deviation of the probability distribution function.
For an ensemble, the width is therefore related to the 'ensemble spread'.
For a forecast ensemble where all values were the same, the CDF would be a vertical straight line.
Plot the CDFs
This exercise uses the cdf.mv icon. Right-click, select 'Edit' and then:
- Plot the CDF of MSLP for the 3 locations listed in the macro.e.g. Reading, Amsterdam, Copenhagen. TODO; what parameters and what location(s)?
- If time, change the forecast run date and compare the CDF for the different forecasts.
| Panel | ||||
|---|---|---|---|---|
| ||||
|
Forecasting during HyMEX : Work in teams for group discussion
Ensemble forecasts can be used to give probabilities to a forecast issued to the publichelp forecasting. This exercise discusses a real-world case of forecasting during HyMEX.
| Panel | ||||
|---|---|---|---|---|
| To be done...
| |||
| Please see separate handout for forecasting exercise. |
Exercise 4: Computing the EOFs and clusters
TO BE DONE
Notes from Frederic: email 7/4/16
...


