Versions Compared

Key

  • This line was added.
  • This line was removed.
  • Formatting was changed.
Comment: Confirmed: Information provided here refers to the introduction of MIR and is currently up to date.

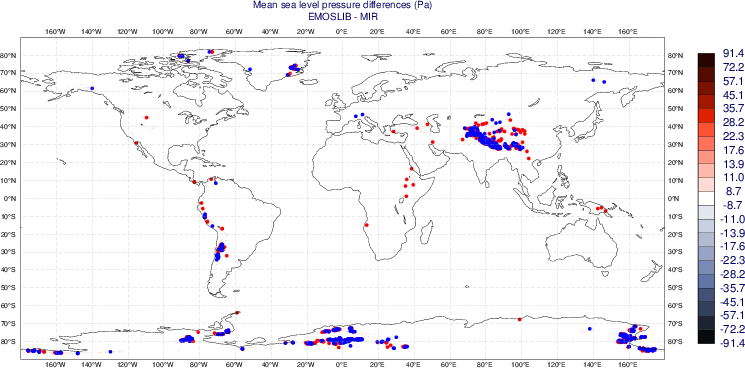
EMOSLIB does not apply any land sea-mask processing when interpolating the mean sea-level pressure so differences arise only from the different interpolation method and selection of nearest points used by MIR

HRES O1280

Mean sea-level pressure has been interpolated from the O1280 octahedral reduced Gaussian grid to regular lat-lon grids at different target resolutions using EMOSLIB and MIR. 

  • The differences for more than 99% of grid points are less than 20Pa and in the cases presented here all differences are less than 1 hPa.
  • The largest differences occur in regions of high orography with the field gradient changes most rapidly.
  • Larger differences are also seen in the lower resolution target grids (0.5ºx0.5º and 1.0ºx1.0º) at the polar latitudes (90ºN and 90ºS) which arise from the different handling of the interpolation at the poles.

The plots show the differences with the contours chosen on a logarithmic scale to enhance the smaller differences. Differences smaller than 0.1% of the field range are not shown. Grid points where the absolute difference is greater than 50% of the maximum absolute difference are indicated with red (EMOSLIB greater than MIR) and blue (EMOSLIB less than MIR) filled circles.


Target resolutionStatistics of differencesHistogram of differencesGlobalEurope
0.1x0.1

Maximum difference = 68.125000
Minimum difference = -91.375000

Average difference = -0.000294
Mean

Mean absolute difference =

-

0.

000294

312304
Median absolute difference =

-

0.125000
Standard deviation = 1.072257

Variance

RMS of differences = 1.

149734

072257

RMS of differences = 1.072257-91.375000 : -73.100000

Percentage of points with absolute difference

        < 1.0 = 95.306%
        < 2.0 = 97.828%
        < 10.0 = 99.743%

-100.0 : -90.0 -          1 (  0.000015%)
  -90.0 : -80.0 -          0 (  0.000000%)
  -80.0 : -70.0 -          1 (  0.000015%)
  -

73

70.

100000

0 : -

54

60.

825000

0 -         

9

5 (  0.

000139%

000077%)
  -

54

60.

825000

0 : -

36

50.

550000

0 -        

80

12 (  0.

001234%

000185%)
  -50.0 : -40.0 -         36

.550000 : -18.275000 -        996

(  0.000555%)
  -40.0 : -30.0 -        153 (  0.002360%)
  -30.0 : -20.0 -        638 (  0.

015362%

009840%)
  -

18

20.

275000 :     0.000000 -    3302198 ( 50.931550%)
    0.000000 :   18.275000 -    3179303 ( 49.036076%)
 18.275000 :   36.550000 -        932 (  0.014375%)
   6.550000 :   54.825000 -         72 (  0.001110%)
 54.825000 :   73.100000 -          9 (  0.000139%)
 73.100000 :   91.375000

0 : -10.0 -       7583 (  0.116957%)
  -10.0 : 0.0 -    3294855 ( 50.818295%)
      0.0 : 10.0 -    3172050 ( 48.924209%)
  10.0 : 20.0 -       7478 (  0.115337%)
  20.0 : 30.0 -        603 (  0.009300%)
  30.0 : 40.0 -        121 (  0.001866%)
  40.0 : 50.0 -         49 (  0.000756%)
  50.0 : 60.0 -         13 (  0.000201%)
  60.0 : 70.0 -          2 (  0.000031%)
  70.0 : 80.0 -          0 (  0.000000%)
  80.0 : 90.0 -          0 (  0.000000%)
  90.0 : 100.0 -          0 (  0.000000%)

Image Removed

Image Added

Image Modified

0.125x0.125

Maximum difference = 92.937500
Minimum difference = -80.062500


Average difference = -0.000149


Mean absolute difference =

-

0.

000149

297040
Median absolute difference =

-

0.062500
Standard deviation = 1.112258

Variance

RMS of differences = 1.

237119

112258

RMS of differences = 1.112258-92.937500 : -74.350000

Percentage of points with absolute difference

        < 1.0 = 95.244%
        < 2.0 = 97.784%
        < 10.0 = 99.717%

-100.0 : -90.0 -          0 (  0.000000%)
  -90.0 : -80.0 -          1 (  0.000024%)
  -80.0 : -70.0 -          3 (  0.000072%)
  -70.0 : -60.0 -         10 (  0.000241%)
  -60.0 : -50.0 -          7 (  0.000169%)
  -

74

50.

350000

0 : -

55

40.

762500

0 -        

13

26 (  0.

000313%

000626%)
  -

55

40.

762500

0 : -

37

30.

175000

0 -        

49

84 (  0.

001181%

002024%)
  -

37

30.

175000

0 : -

18

20.

587500

0 -       

563

387 (  0.009325%)
  -20.0 : -10.0 -       5446 (  0.

013566%

131226%)
  -

18

10.

587500

0 :


0.

000000

0 -   

2867529

2862191 (

69

68.

095752%

967128%)


      0.

000000

0 :

   18

10.

587500

0 -   

1281313

1276136 ( 30.

874417%

749672%)

 18

   10.

587500 :   37.175000 -        556

0 : 20.0 -       5303 (  0.127781%)
   20.0 : 30.0 -        362 (  0.

013397%

008723%)

 37

   30.

175000 :  55.762500 -         46

0 : 40.0 -         81 (  0.001952%)
   40.0 : 50.0 -         28 (  0.000675%)
    50.0 : 60.0 -          9 (  0.000217%)
    60.0 : 70.0 -          2 (  0.

001108%

000048%)

 55

    70.

762500 :  74.350000 -          6

0 : 80.0 -          3 (  0.000072%)
    80.0 : 90.0 -          0 (  0.

000145%

000000%)
 

74

  90.

350000

0 :

92

100.

937500

0 -         

4

1 (  0.

000096%

000024%)

Image Removed

Image Added

Image Modified

0.25x0.25

Maximum difference = 92.875000
Minimum difference = -61.875000

Average difference = 0.000752

Mean absolute difference = 0.

000752

338583
Median absolute difference =

-

0.125000
Standard deviation = 1.266861

Variance

RMS of differences = 1.

604937

266861

RMS of differences = 1.266861-92.875000 : -74.300000

Percentage of points with absolute difference

        < 1.0 = 95.149%
        < 2.0 = 97.663%
        < 10.0 = 99.580%

-100.0 : -90.0 -          0 (  0.000000%)
  -90.0 : -80.0 -          0 (  0.000000%)
  -80.0 : -70.0 -          0 (  0.000000%)

-74.300000 : -55.725000

  -70.0 : -60.0 -          4 (  0.000385%)
  -60.0 : -50.0 -          4 (  0.000385%)
  -50.0 : -40.0 -          6 (  0.000578%)
  -

55

40.

725000

0 : -

37

30.

150000

0 -        

12

15 (  0.

001156%

001445%)
  -

37

30.

150000

0 : -

18

20.

575000

0 -       

150

101 (  0.009728%)
  -20.0 : -10.0 -       2043 (  0.

014448%

196775%)
  -

18

10.

575000

0 : 0.

000000

0 -    

529369

527362 ( 50.

987151%

793843%)


      0.

000000

0 :

18

10.

575000

0 -    

508549

506516 ( 48.

981835%)
18.575000 : 37.150000 -        141

786022%)
   10.0 : 20.0 -       2066 (  0.198991%)
   20.0 : 30.0 -         93 (  0.

013581%

008957%)

37

   30.

150000

0 :

55

40.

725000 -         12

0 -         19 (  0.001830%)
  40.0 : 50.0 -          6 (  0.000578%)
  50.0 : 60.0 -          2 (  0.000193%)
  60.0 : 70.0 -          1 (  0.

001156%

000096%)

55

  70.

725000

0 :

74

80.

300000

0 -          1 (  0.000096%)

74.300000 : 92.875000 -          2

  80.0 : 90.0 -          0 (  0.000000%)
  90.0 : 100.0 -          1 (  0.

000193%

000096%)

Image Removed

Image Added

Image Modified

0.5x0.5

Maximum difference = 51.000000
Minimum difference = -61.000000


Average difference = 0.004363


Mean absolute difference = 0.

004363

309541
Median absolute difference = 0.000000
Standard deviation = 1.523147

Variance = 2.319977

RMS of differences = 1.523153

Percentage of points with absolute difference

        < 1.0 = 94.304%
        < 2.0 = 97.268%
        < 10.0 = 99.306%

-70.0 : -60.0 -          2 ( 

-61.000000 : -48.800000 -          3

0.000769%)
-60.0 : -50.0 -          1 (  0.000385%)
-50.0 : -40.0 -          1 (  0.

001154%

000385%)
-

48

40.

800000

0 : -

36

30.

600000

0 -         

2

3 (  0.

000769%

001154%)
-

36

30.

600000

0 : -

24

20.

400000

0 -        

13

21 (  0.

005002%

008079%)
-

24

20.

400000

0 : -

12

10.

200000

0 -       

818

855 (  0.

314712%

328947%)
-

12

10.

200000

0 : 0.

000000

0 -     

41933

41886 ( 16.

133041%

114958%)


    0.

000000

0 :

12

10.

200000

0 -    

216306

216238 ( 83.

220222%

194060%)

12

 10.

200000

0 :

24

20.

400000

0 -       

825

871 (  0.

317405%

335103%)

24

 20.

400000

0 :

36

30.

600000

0 -        

15

33 (  0.012696%)
 30.0 : 40.0 -          6 (  0.

005771%

002308%) 

36

 40.

600000

0 :

48

50.

800000

0 -         

4

2 (  0.

001539%

000769%)

48

  50.

800000

0 :

61

60.

000000

0 -          1 (  0.000385%)
  60.0 : 70.0 -          0 (  0.000000%)

Image Removed

Image Added

Image Modified

1.0x1.0

Maximum difference = 50.937500
Minimum difference = -60.812500


Average difference = 0.012001


Mean absolute difference = 0.

012001

437874
Median absolute difference =

-

0.062500
Standard deviation = 1.932739

Variance = 3.735481

RMS of differences = 1.932777

-60.812500 : -48.650000

 Percentage of points with absolute difference

        < 1.0 = 94.672%
        < 2.0 = 96.980%
        < 10.0 = 98.766%

-70.0 : -60.0 -          1 (  0.001535%)
-

48.650000 : -36.487500

60.0 : -50.0 -          0 (  0.000000%)
-50.0 : -40.0 -          0 (  0.000000%)
-

36

40.

487500

0 : -

24

30.

325000

0 -          0 (  0.000000%)
-30.0 : -20.0 -          2 (  0.003069%)
-

24

20.

325000

0 : -

12

10.

162500

0 -       

382

389 (  0.

586249%

596992%)
-

12

10.

162500

0 : 0.

000000

0 -     

44628

44619 ( 68.

489871%

476059%)
    0.

000000

0 :

12

10.

162500

0 -     

19754

19737 ( 30.

316145%

290055%)

  12

 10.

162500

0 :

24

20.

325000

0 -       

388

401 (  0.

595457%

615408%)

  24.325000 : 36.487500 -          6

 20.0 : 30.0 -          9 (  0.013812%)
 30.0 : 40.0 -          1 (  0.

009208%

001535%)

  36

 40.

487500

0 :

48

50.

650000

0 -          0 (  0.000000%)

 48

 50.

650000

0 : 60.

812500

0 -          1 (  0.001535%)
 60.0 : 70.0 -          0 (  0.000000%)

Image Removed

Image Added

Image Modified