Daily data
You will find two CDS catalogue entries labelled 'daily data'; these contain data at daily or subdaily frequency (6h, 12h or 24h) . The output of the different forecasting systems is available both for real-time forecasts (from 2017 onwards) and retrospective forecasts (referred to as hindcasts) for the period 1993-2016.
Note that all available individual members for each forecasting system will be provided with every request.
One dataset contains surface (or single level) parameters, the other contains variables on 11 pressure levels spanning 925 hPa to 10 hPa.
...
| title | Seasonal forecast daily data on single levels from 2017 to present |
|---|
01. Originating Centre
Select the name of the institution the forecasting system of your interest originates from.

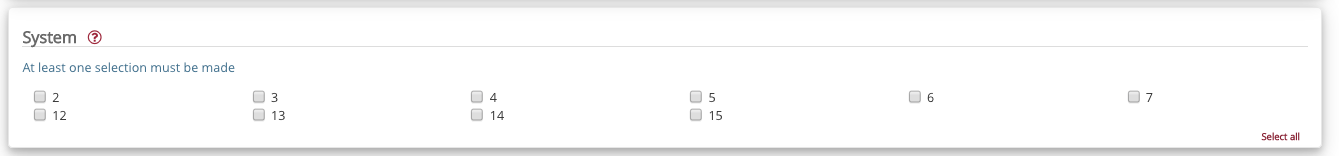
02. System
...
one CDS catalogue entry called "CORDEX regional climate model data on single levels for Europe". Please note that not all the combinations of selections exist. This feature is inherited from the ESGF system, where the main target is to publish as much as possible data and even publish incomplete datasets, which might be of use. This allows to have more data available with the price that not everything is fully complete. Below we describe briefly all widgets available at the CDS catalogue download tab. See the CDS form at https://cds.climate.copernicus.eu/cdsapp#!/dataset/projections-cordex-single-levels?tab=form More details are given at CORDEX: Regional climate projections
01. Experiment
Select the experiment of your interest. Evaluation is an experiment for a past period using reanalysis (ERA-Interim boundary conditions). Historical experiments are also for the past, but using Global Climate Models (GCM) as boundary conditions. Three scenarios for the future can be selected: RCP 2.6, RCP 4.5 and RCP 8.5 representing different pathways of the future climate forcing.

02. Temporal resolution
Select the temporal resolution of your choice.
03. Variable
Select the parameter(s) you are interested in.

04. Year
Select the year of the initialization date of the model run(s) you are interested in.
Note that there could be differences in the options available depending on your selection of forecast or hindcast years.
Please note that you must use the hindcast data in order to make a meaningful use of the forecast data. And remember you must pair forecasts and hindcasts up by using the same "system" for both of them.

05. Month
Select the month of the initialization date of the model run(s) you are interested in.

06. Day
Select the day of the initialization date of the model run(s) you are interested in.
Note that due to different production schedules, the available dates may differ between hindcasts and forecasts and between "originating centres".
You can find more details about the production schedules in the "Documentation" tab.

07. Leadtime Hour
Select the lead time(s) you are interested in. This is the time, in hours, from the initialization date.
Bear in mind that some variables are available every 6 hours, and some every 24 hours. You will find that information in the full list of available parameters from the "Documentation" tab and also in the summary table shown in the "Overview" tab of this CDS dataset.
Note that the length of the outputs is at least 6 calendar months, but it may not be the same for all "originating centres".
...
...
...
08. Geographical area
You can select a global field ("whole available area") or a regional subselection by providing the latitude and longitude of its corners

09. Format
You can select the data format for your data retrieval.
Currently, just GRIB format is available for C3S seasonal forecast datasets.
An experimental netCDF conversion can be accessed by using the CDS API. You can find some related information in the "Documentation" tab.

10. Terms of Use
You must accept the terms and conditions of the Copernicus User Licence in order to access the C3S seasonal forecast data.

...
| title | Seasonal forecast daily data on pressure levels from 2017 to present |
|---|
01. Originating Centre
Select the name of the institution the forecasting system of your interest originates from.
02. System
...
03. Variable
Select the parameter(s) you are interested in.

04. Pressure Level
Select the pressure level(s) for the variables you are interested in.

05. Year
Select the year of the initialization date of the model run(s) you are interested in.
Note that there could be differences in the options available depending on your selection of forecast or hindcast years.
Please note that you must use the hindcast data in order to make a meaningful use of the forecast data. And remember you must pair forecasts and hindcasts up by using the same "system" for both of them.
06. Month
Select the month of the initialization date of the model run(s) you are interested in.
07. Day
Select the day of the initialization date of the model run(s) you are interested in.
Note that due to different production schedules, the available dates may differ between hindcasts and forecasts and between "originating centres".
You can find more details about the production schedules in the "Documentation" tab.
08. Leadtime Hour
Select the lead time(s) you are interested in. This is the time, in hours, from the initialization date.
Note that the length of the outputs is at least 6 calendar months, but it may not be the same for all "originating centres".

...

09. Geographical area
You can select a global field ("whole available area") or a regional subselection by providing the latitude and longitude of its corners.
10. Format
You can select the data format for your data retrieval.
Currently, just GRIB format is available for C3S seasonal forecast datasets.
An experimental netCDF conversion can be accessed by using the CDS API. You can find some related information in the "Documentation" tab.
11. Terms of Use
You must accept the terms and conditions of the Copernicus User Licence in order to access the C3S seasonal forecast data.
Monthly data
You will find two CDS catalogue entries for monthly statistics: monthly average, minimum, maximum and standard deviation are available for all initialization dates. Additionally, for real-time forecast initialization dates you will find the ingredients to calculate the forecast monthly anomalies: the forecast ensemble mean and the hindcast climate mean. The output of the different forecasting systems is available both for real-time forecasts (from 2017 onwards) and retrospective forecasts (referred to as hindcasts) for the period 1993-2016.
One dataset contains surface (or single level) parameters, the other contains variables on 11 pressure levels spanning 925 hPa to 10 hPa.
...
| title | Seasonal forecast monthly statistics on single levels from 2017 to present |
|---|
01. Originating Centre
Select the name of the institution the forecasting system of your interest originates from.
02. System
...
03. Variable
Select the parameter(s) you are interested in.

04. Product Type
Select the monthly product you are interested in.
Note that the products under the category "Individual members" consist of all available individual ensemble members, while those in the category "Ensemble" have a single value for each forecast system ensemble.

05. Year
Select the year of the initialization date of the model run(s) you are interested in.
Note that there could be differences in the options available depending on your selection of forecast or hindcast years.
Please note that you must use the hindcast data in order to make a meaningful use of the forecast data. And remember you must pair forecasts and hindcasts up by using the same "system" for both of them.
06. Month
Select the month of the initialization date of the model run(s) you are interested in.
Note that in the current setup all monthly products are encoded using as nominal start date the 1st of each month, regardless of the real initialization date. You can find more information about how nominal start dates are assigned in the "Documentation" tab.
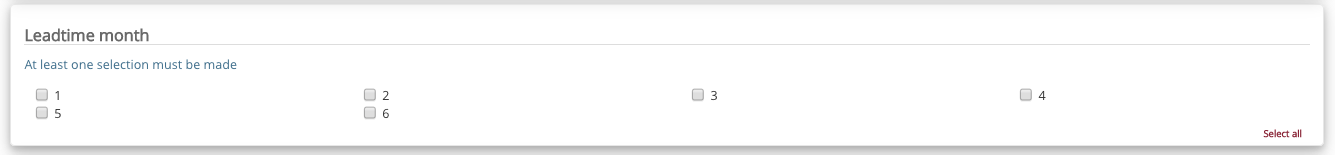
07. Leadtime Month
Select the lead time(s) you are interested in. This is the time, in months, from the initialization date.
Note that the convention used for labelling the data implies that leadtime_month=1 is the first complete calendar month after the initialization date. In the current setup of all datasets that means that for a forecast initialised on the 1st of November, leadtime_month=1 is November.
08. Geographical area
You can select a global field ("whole available area") or a regional subselection by providing the latitude and longitude of its corners.
09. Format
You can select the data format for your data retrieval.
Currently, just GRIB format is available for C3S seasonal forecast datasets.
An experimental netCDF conversion can be accessed by using the CDS API. You can find some related information in the "Documentation" tab.
10. Terms of Use
You must accept the terms and conditions of the Copernicus User Licence in order to access the C3S seasonal forecast data.
...
| title | Seasonal forecast monthly statistics on pressure levels from 2017 to present |
|---|
01. Originating Centre
Select the name of the institution the forecasting system of your interest originates from.
02. System
...

03. Variable
Select the parameter(s) you are interested in.
...
04. Pressure Level
Select the pressure level(s) for the variables you are interested in.
05. Product Type
Select the monthly product you are interested in.
Note that the products under the category "Individual members" consist of all available individual ensemble members, while those in the category "Ensemble" have a single value for each forecast system ensemble.
06. Year
Select the year of the initialization date of the model run(s) you are interested in.
Note that there could be differences in the options available depending on your selection of forecast or hindcast years.
Please note that you must use the hindcast data in order to make a meaningful use of the forecast data. And remember you must pair forecasts and hindcasts up by using the same "system" for both of them.
07. Month
Select the month of the initialization date of the model run(s) you are interested in.
Note that in the current setup all monthly products are encoded using as nominal start date the 1st of each month, regardless of the real initialization date. You can find more information about how nominal start dates are assigned in the "Documentation" tab.
08. Leadtime Month
Select the lead time(s) you are interested in. This is the time, in months, from the initialization date.
Note that the convention used for labelling the data implies that leadtime_month=1 is the first complete calendar month after the initialization date. In the current setup of all datasets that means that for a forecast initialised on the 1st of November, leadtime_month=1 is November.
...
09. Geographical area
You can select a global field ("whole available area") or a regional subselection by providing the latitude and longitude of its corners.
10. Format
You can select the data format for your data retrieval.
Currently, just GRIB format is available for C3S seasonal forecast datasets.
An experimental netCDF conversion can be accessed by using the CDS API. You can find some related information in the "Documentation" tab.
11. Terms of Use
You must accept the terms and conditions of the Copernicus User Licence in order to access the C3S seasonal forecast data.
Post-processed data
You will find two CDS catalogue entries for real-time forecast monthly anomalies; each contains the anomalies for the ensemble mean for each system and the individual ensemble members.
Anomalies are just available for real-time forecasts start dates (from 2017 onwards).
One dataset contains surface (or single level) parameters, the other contains variables on 11 pressure levels spanning 925 hPa to 10 hPa.
| Expand | ||
|---|---|---|
| ||
01. Originating CentreSelect the name of the institution the forecasting system of your interest originates from.
02. SystemSelect the version of the forecasting system. This is a numeric label and the available values are different for the different "originating centres".
03. VariableSelect the parameter(s) you are interested in.
04. Product TypeSelect the monthly product you are interested in.
05. YearSelect the year of the initialization date of the model run(s) you are interested in.
06. MonthSelect the month of the initialization date of the model run(s) you are interested in.
07. Leadtime MonthSelect the lead time(s) you are interested in. This is the time, in months, from the initialization date.
08. Geographical areaYou can select a global field ("whole available area") or a regional subselection by providing the latitude and longitude of its corners.
09. FormatYou can select the data format for your data retrieval.
10. Terms of UseYou must accept the terms and conditions of the Copernicus User Licence in order to access the C3S seasonal forecast data.
|

...
| title | Seasonal forecast anomalies on pressure levels from 2017 to present |
|---|
01. Originating Centre
Select the name of the institution the forecasting system of your interest originates from.
02. System
Select the version of the forecasting system. This is a numeric label and the available values are different for the different "originating centres".
A full description of the use of the system keyword is available from the "Documentation" tab.
03. Variable
Select the parameter(s) you are interested in.

04. Pressure Level
Select the pressure level(s) for the variables you are interested in.
05. Product Type
Select the monthly product you are interested in.
Note that the products under the category "Individual members" consist of all available individual ensemble members, while those in the category "Ensemble" have a single value for each forecast system ensemble.

06. Year
Select the year of the initialization date of the model run(s) you are interested in.
Note that anomalies are just available for real-time forecasts start dates.

07. Month
Select the month of the initialization date of the model run(s) you are interested in.
Note that in the current setup all monthly products are encoded using as nominal start date the 1st of each month, regardless of the real initialization date. You can find more information about how nominal start dates are assigned in the "Documentation" tab.
08. Leadtime Month
Select the lead time(s) you are interested in. This is the time, in months, from the initialization date.
Note that the convention used for labelling the data implies that leadtime_month=1 is the first complete calendar month after the initialization date. In the current setup of all datasets that means that for a forecast initialised on the 1st of November, leadtime_month=1 is November.
09. Geographical area
You can select a global field ("whole available area") or a regional subselection by providing the latitude and longitude of its corners.
10. Format
You can select the data format for your data retrieval.
Currently, just GRIB format is available for C3S seasonal forecast datasets.
An experimental netCDF conversion can be accessed by using the CDS API. You can find some related information in the "Documentation" tab.
11. Terms of Use
Since no separate pressure level catalogue entry exists in the CDS here you can find data on some of the main pressure levels.

04. Global Climate Model
Select the Global Climate Model (GCM) used as lateral boundary conditions. For the evaluation experiments only ERA-Interim reanalysis can be chosen.

05. Regional Climate Model
Select the Regional Climate Model (RCM) you are interested in.

06. Simulation version
Select the simulation version. Mostly we have only one simulation per model, therefore usually the previous choices leave only one choice. The different versions are available for the HIRHAM5, RACMO22E and RCA4 models.

07. Ensemble member
Select the ensemble members of the experiment. The ensemble members are coming from the driving Global Climate Models (GCMs).

08. Start year
Select the start year of the experiment you are interested in. Please note that the data are stored in batches therefore you might get more data than you asked for.

09. End year
Select the end year of the experiment you are interested in. Please note that the data are stored in batches therefore you might get more data than you asked for.
10. Format
Select your preferred format for compression.

You must accept the terms and conditions of the Copernicus User Licence in order to access the C3S seasonal forecast data.
...