Magics Version 4.12.0
Have a look at the notebook or try it on binder : ![]()
EPSG:3035 projection
map = magics.mmap(
subpage_map_projection = 'EPSG:3035',
)

Automatic adjustment of the projection according to the data extend
area = magics.mmap( subpage_map_projection = 'EPSG:3035',
subpage_map_area_definition = "data")

Automatic selection of the best suited projection according to the data extend
map = magics.mmap(
subpage_map_projection = 'automatic',
)

Introduction of a new way to work with palette of colour lists.
contour = magics.mcont(
legend = 'on',
contour = 'off',
contour_shade = 'on',
contour_label = 'off',
contour_level_selection_type = "count",
contour_level_count = 30,
contour_interval = contour_interval,
contour_level_tolerance = 0,
contour_shade_method = 'area_fill',
contour_shade_palette_name = "colorbrewer_RdBl",
contour_shade_colour_list_policy = "dynamic",
contour_shade_colour_reverse_list = contour_shade_colour_reverse_list,
contour_shade_colour_method = "palette")

Thinning of the wind when using NetCDF data.
Magics Version 4.11.0
User defined coastlines: Magics has the possibility for users to use their own set of shapefiles as coastlines. In this version, we added a parameter map_user_layer_land_colour(Default:NONE). If given a colour , the user coastlines will be filled.

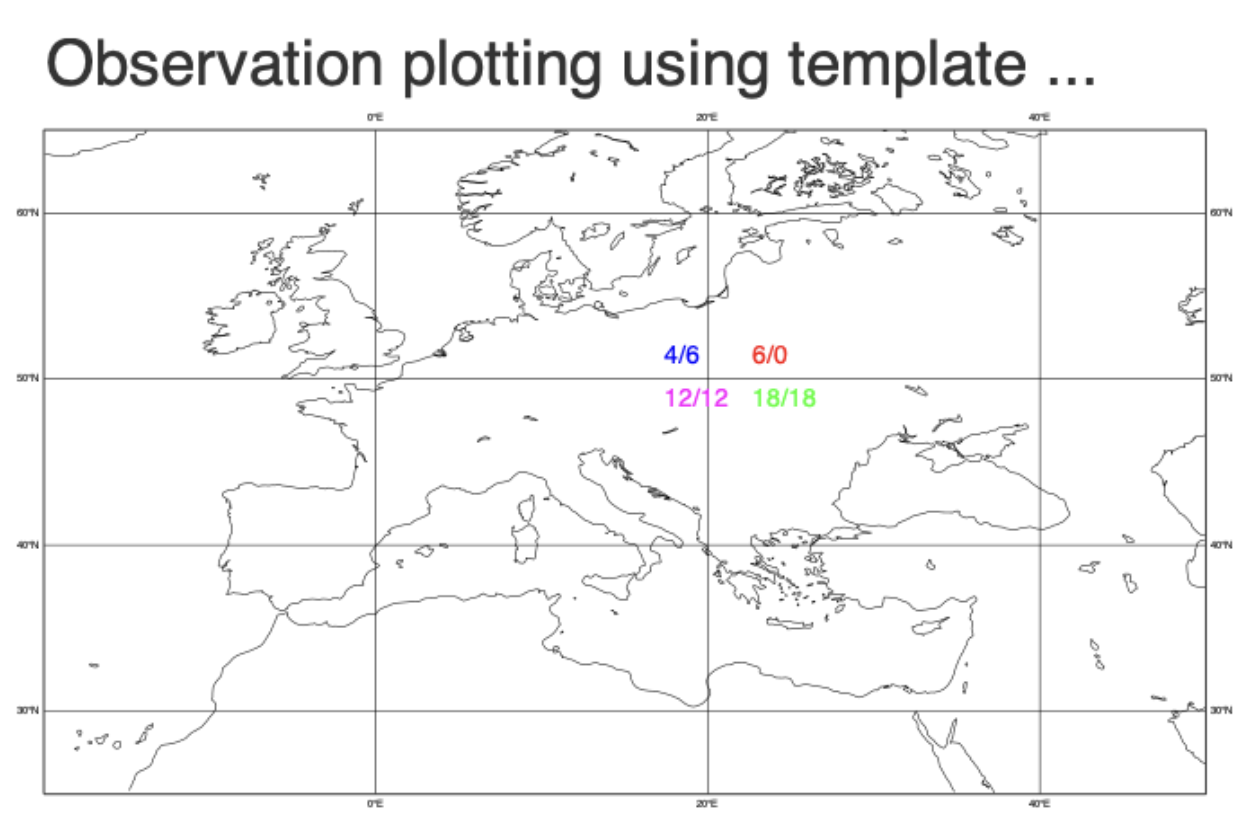
- Observations plotting using template(Small issues fixed): Magics allows users to define a XML template to display observations-like information.
The template describes how to position the information. Users is able to pass a json object as observation, and Magics will use the template to position the different items of the observation.
LineString in GeoJSon: Magics is now supporting the feature Linestring from the GeoJSON format.

Fortran interface : A bug fix when calling popen/pclose several times.
Magics Version 4.10.0
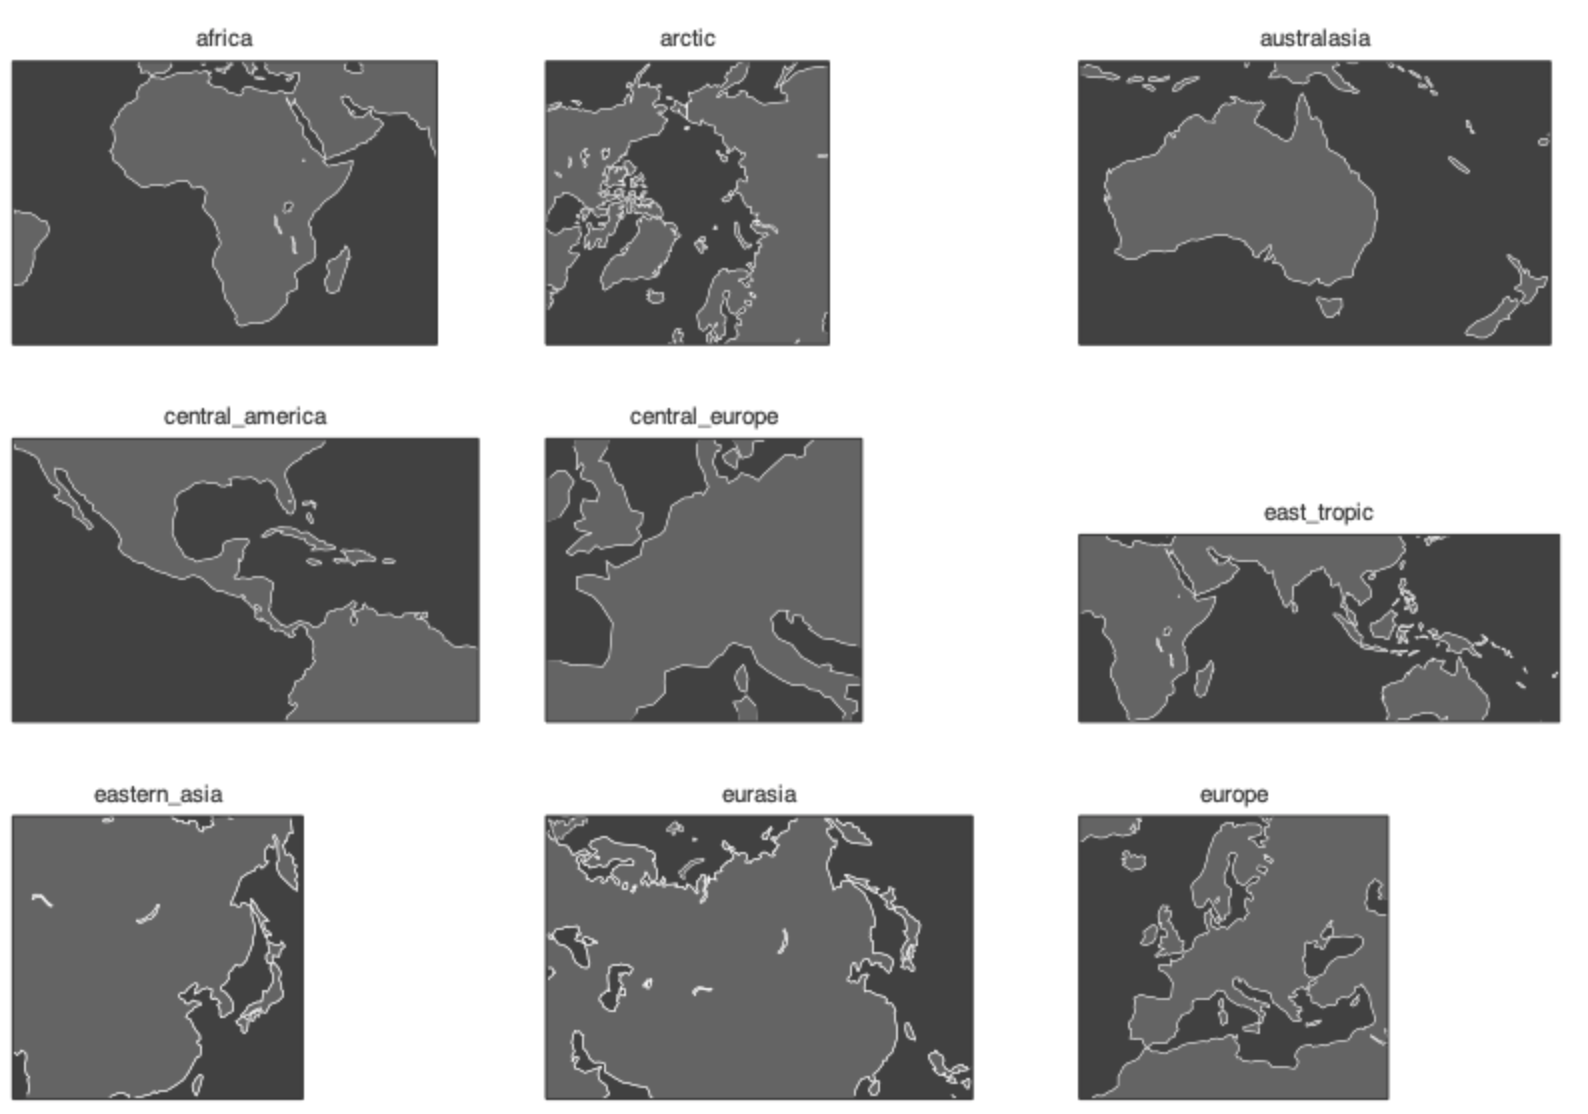
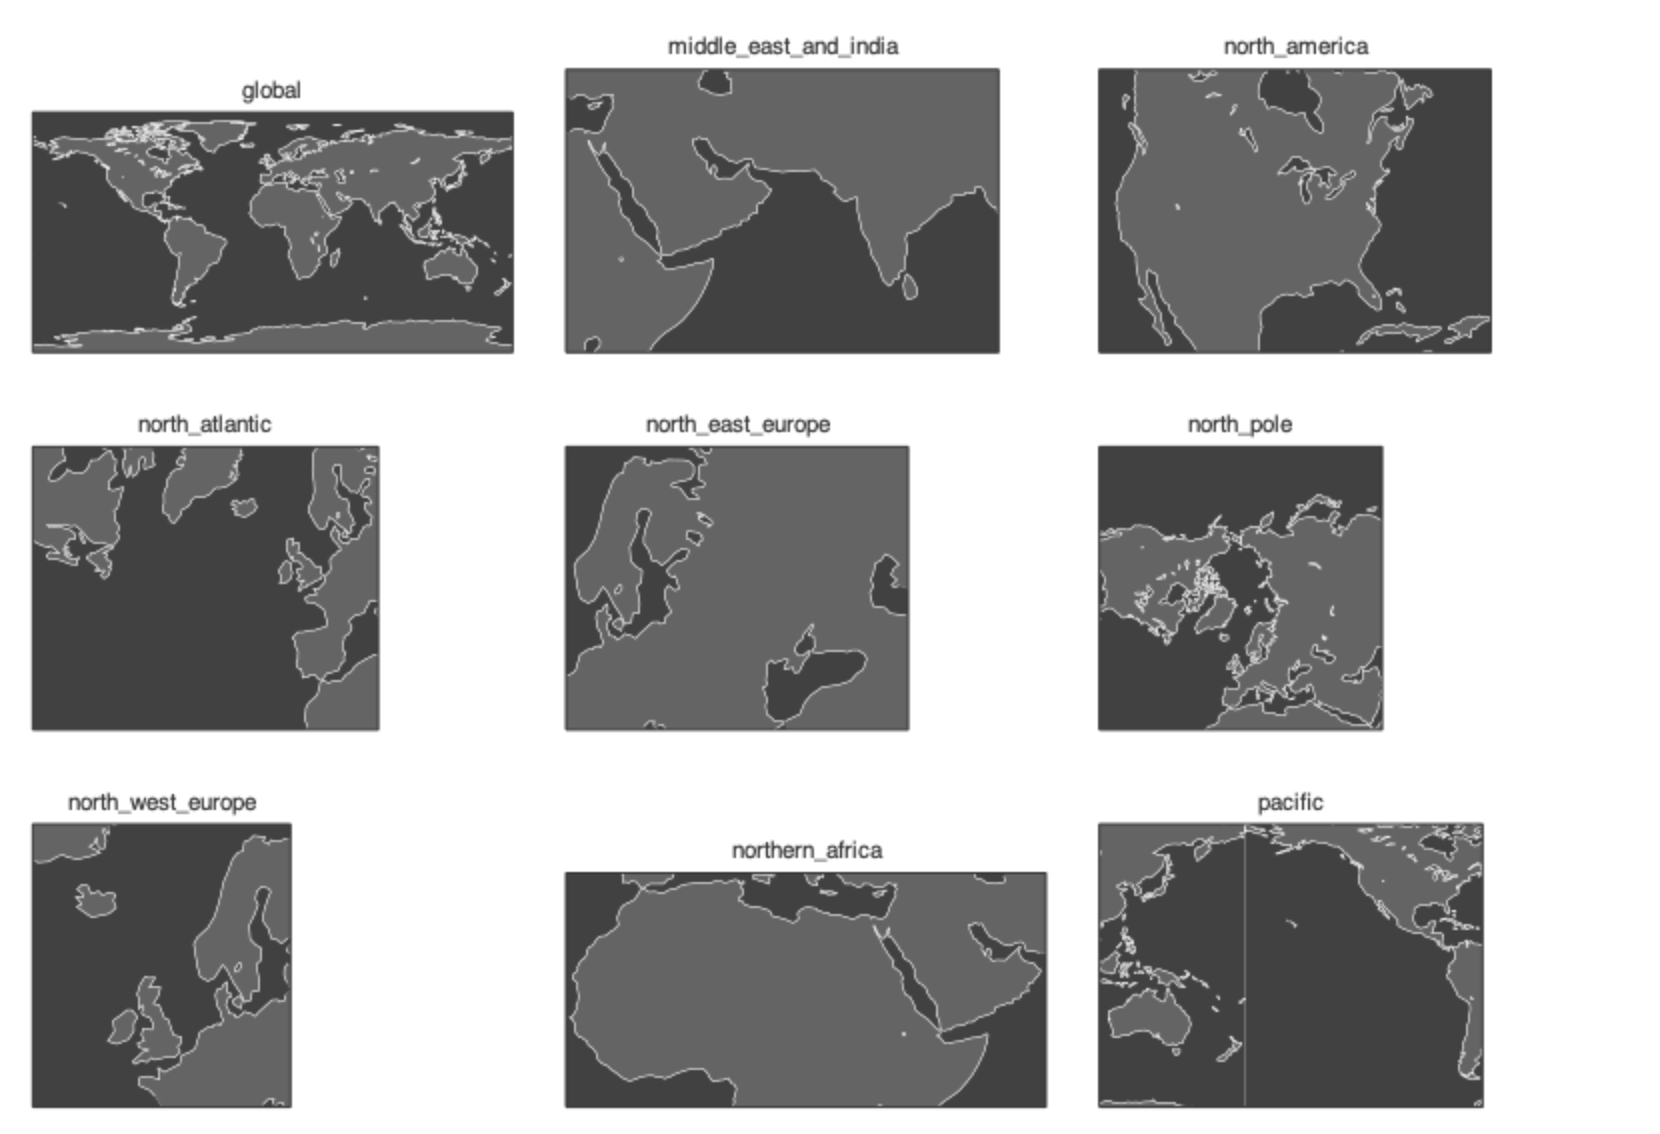
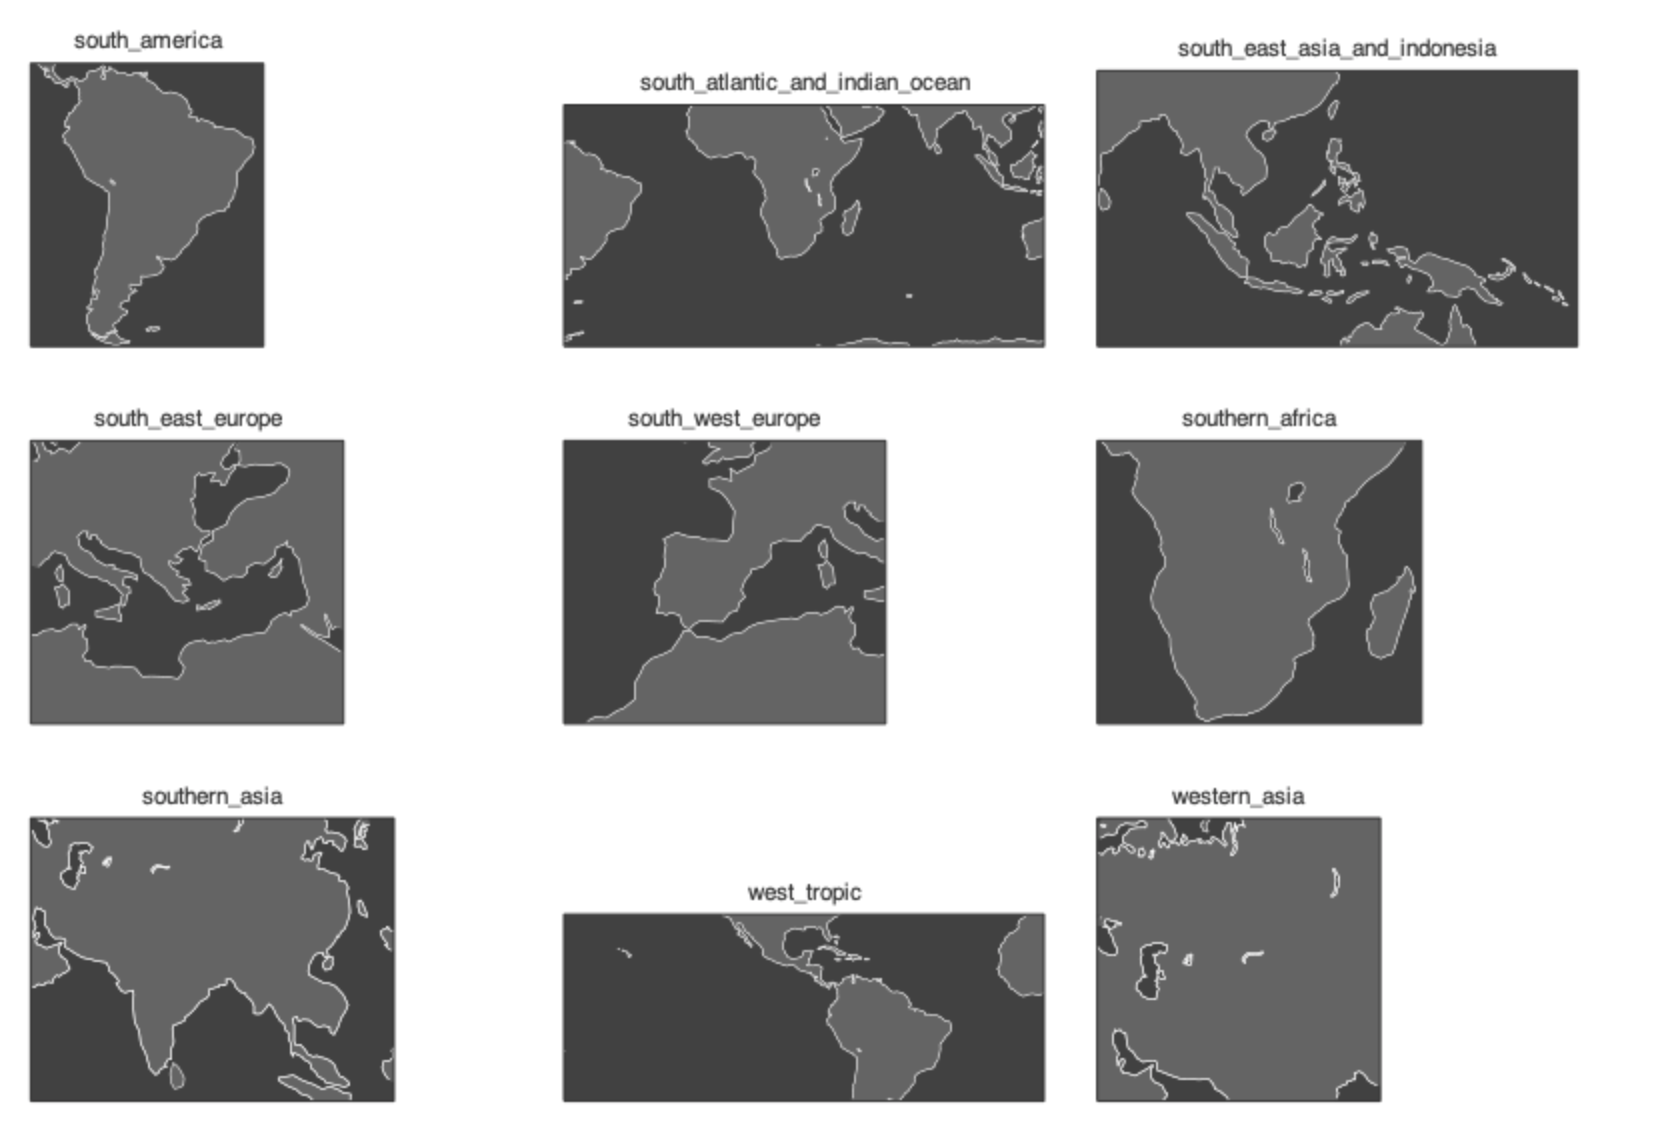
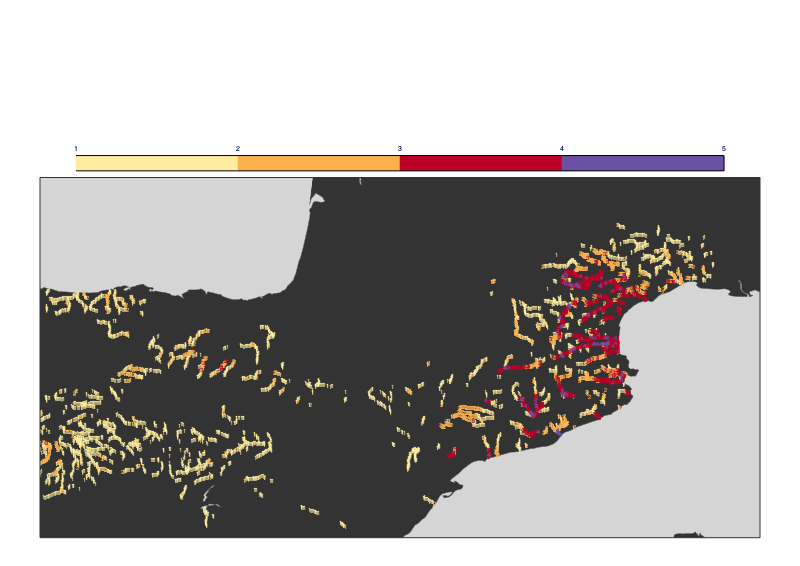
- The list of predefined geographical areas has been aligned with the list of geographical areas offered in the opencharts catalogue. To use them :
|
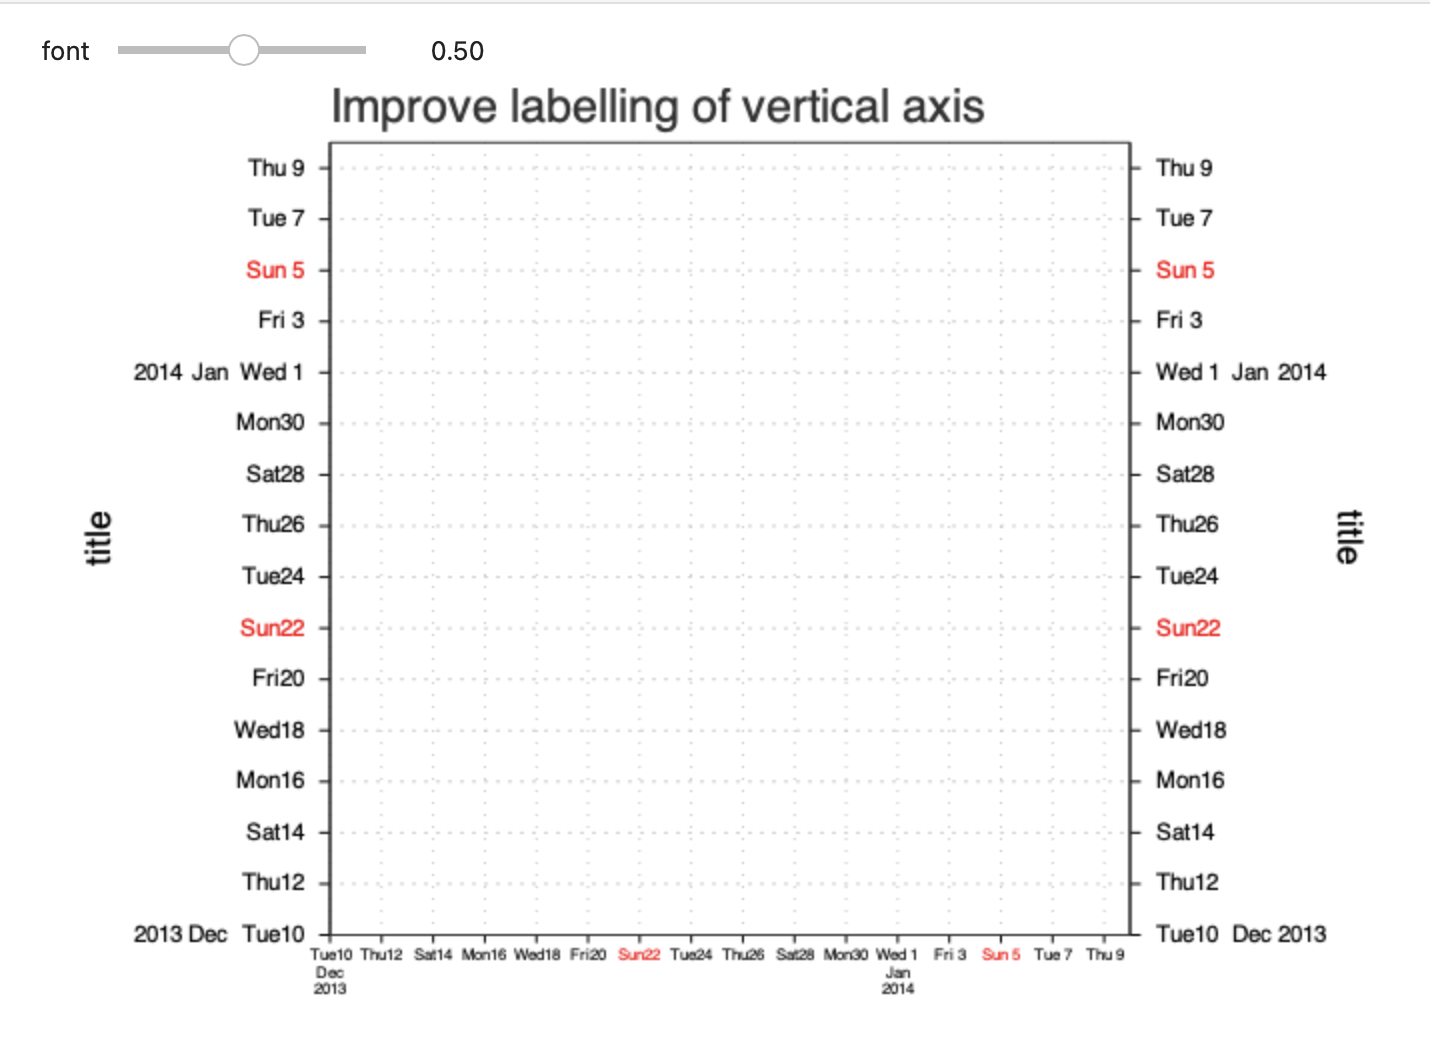
- Improve positioning of axis labels in cartesian view.
- Improvement to symbol plotting with NetCDF data
- Fix issues with multiple calls to the python plot method.
Magics Version 4.9.3
- extra fix for the Fortran bindings
Magics Version 4.9.1
- re-enabled the Fortran bindings, which had been missing since version 4.8.0.
Magics Version 4.9.0
- A first implementation of automatic styling for wind is ready to test: as for the automatic contour styling magics will try try to interpret the metadata and apply a predefined style. Please report any issue and do not hesitate to send feedback.

- 1 new magics parameter is available wind_automatic_setting if set to ecmwf, magics will try to find a predefined style.
- Geopoints items with missing values are now ignored.
- Scaling for parameter mudlp has been added
Magics Version 4.8.0
- fix in the grid_shading method where the maximum value was sometimes unshaded
- new global font scaling options for PNG and PDF output
- Improved support for wind plotting on tiling mode ( SkinnyWMS)

- Improved support for title creation in Metview
- Improved automatic styling
- Major refactoring of the code
Magics Version 4.6.0
- Support has been added for NetcDF data coded with int64
- Compilation support proj8
- Improved automatic styling and scaling
- Metview support: Few fixes in the overlay rules.
Magics Version 4.5.3
- New palettes have been imported from matplotlib and Colorbrewer (https://colorbrewer2.org/): See the full list can be found at Predefined palettes in Magics.

- Improvements have been done on the tilted perspective (tpers) projection allowing now to create nice animations.
. 
- Memory leaks have been found and fixed.
Magics Version 4.5.1
contour_interpolation_ceiling fixed for rotated grids
- small fixes with setting of netCDF dimesions.
Versions in use at ECMWF
...
Magics Version 4.5.0
...