| Scroll pdf ignore | ||||||||||||||||||||||||||||
|---|---|---|---|---|---|---|---|---|---|---|---|---|---|---|---|---|---|---|---|---|---|---|---|---|---|---|---|---|
|
Overview
In this session, you should explore some of the other features that Metview has to offer. You can either do whatever you please, or follow some of the suggestions below.
Working with Folders and Icons
Go through this tutorial to become more proficient at using Metview's user interface for navigating folders and finding icons.
Monitoring Metview's Processes
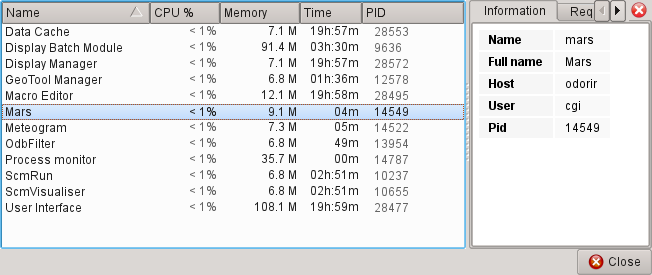
Metview has a built-in task monitor, available from the Tools menu on the menu bar (Process Monitor…). This tool allows you to see which processes Metview is currently running. It also allows some control, such as the ability to abort processes (right-click menu on each process’s entry).
Often, Metview processes are run so quickly that you barely see them in the Process Monitor. However, data retrievals and complex computations can take longer. Experiment with this tool; keep it running while you perform some computations or visualise some data.
Explore Metview's Icons
Have a look at the available icons in the New Icon dialogue - investigate some that interest you!
Plot Coloured Wind Fields
XXXX screenshot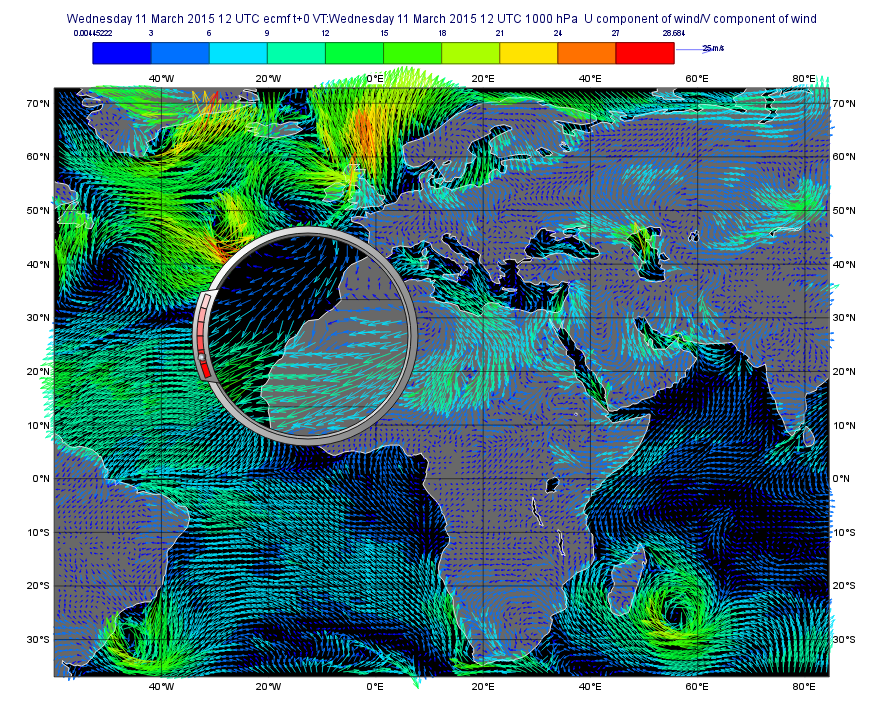
Create a new Wind Plotting icon and set the following parameters in order to colour the arrows according to the wind speed:
| Legend | On |
| Wind Thinning Factor | 1 |
| Wind Advanced Method | On |
| Wind Advanced Colour Max Level Colour | Red |
| Wind Advanced Colour Min Level Colour | Blue |
| Wind Advanced Colour Direction | Clockwise |
Wind Advanced Colour Parameter | Speed |
Visualise ztuv.grb from the Data Part 1 session and move to a wind field. Drop the new Wind Plotting icon into the plot window. This plot is clearer if dark grey land/sea shading is used.
Meteograms
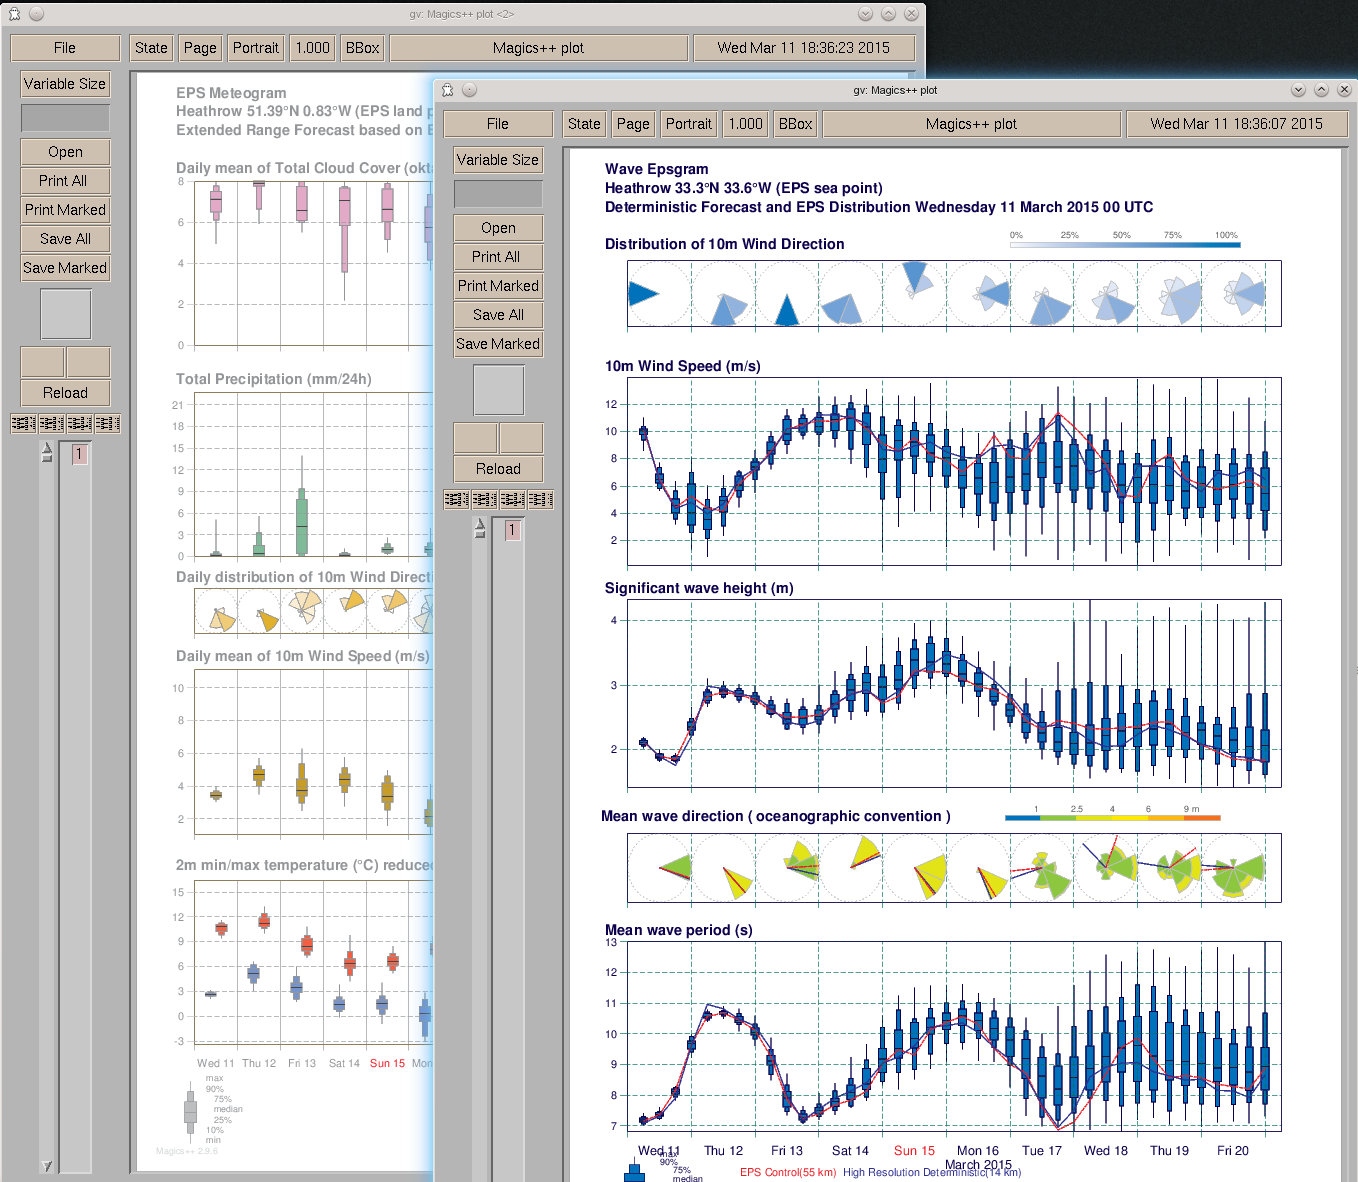
Also available is the Meteogram icon (only available at ECMWF). This icon uses an embedded Stations icon; use it, but edit it before using it. This is will allow you to explore the Stations editor; this provides access to thousands of WMO stations.
...
When you visualise the Meteogram icon, it will send a request to ECMWF’s server which will generate a meteogram plot.
Running Shell Scripts
The Shell Script icon allows you to enter shell commands such as ‘ls’. You can run the commands directly from the editor, in which case the output will appear in the Output area at the bottom, or else you can right-click execute and look at the icon’s output messages.
Storing Text Notes
The Notes icon stores plain text, so you can use this to make notes. General text files copied into a Metview folder will appear as Notes icons.
Using Web Map Services (WMS)
Metview provides a module to request maps from a Web Map Services (WMS). The WMS standard is defined by the Open Geospatial Consortium (OGC), which is very popular in the GIS community. The WMS module can be used to query an OGC-compliant WMS server, retrieve maps from it and overlay them with other data. The WMS icon is a great way to integrate web services within Metview.
We have a separate tutorial which shows in more detail how you can use maps served by web map services within Metview.
- We provided you with some example WMS icons. Try out the four WMS icons in the directory by visualising them.
- Edit the icons to see the catalogues of layers available.
- Drop the icon into a macro editor to explore how a WMS retrieval looks like.
Trajectories (FLEXTRA)
XXXX screenshot
FLEXTRA is an established trajectory model used by growing scientific community. Metview has a set of icons for interacting with FLEXTRA at all stages: preparing the data, running the model and visualising the output.
...