| Scroll pdf ignore | ||||||||||||||||||||||||||||
|---|---|---|---|---|---|---|---|---|---|---|---|---|---|---|---|---|---|---|---|---|---|---|---|---|---|---|---|---|
|
Case description
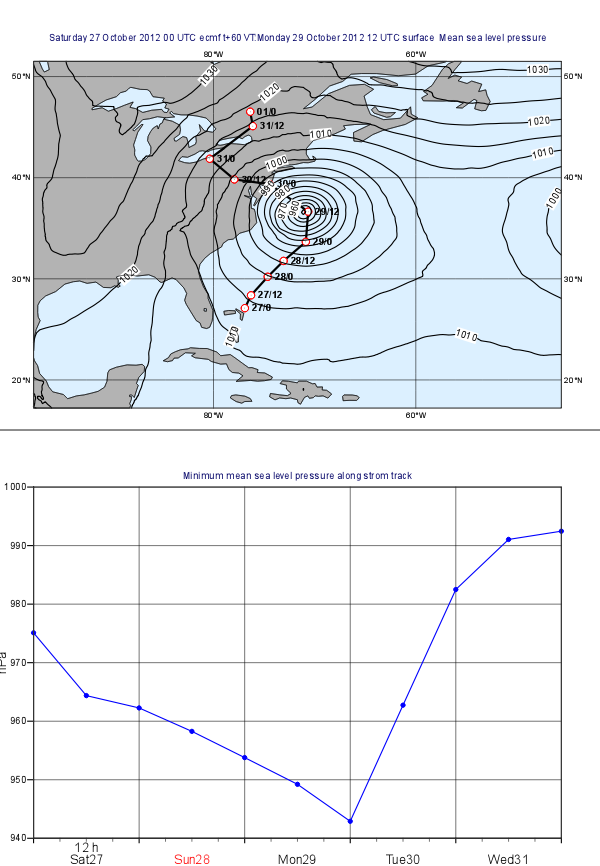
In this exercise we will use Metview to produce the plots shown above:
...
Next, we build the list of labels. Each label is made up from a day and an hour part separated by a slash. We convert the date into a string and then take the last two characters to get the day. Use this loop to construct the list of labels:
| Code Block |
|---|
labels=nil

for i=1 to count(val_date) do
    dPart = substring(string(val_date[i]),7,8)
    tPart = val_time[i]
    label =  "   " & dPart & "/" & tPart
    labels = labels & [label]
end for |
...
Create new Macro and edit it. First, read the CSV file in the very same way as before. However, this time, on top of date and time, we also need to read latitude and longitude into vectors:
| Code Block |
|---|
val_latlon=values(tbl,3) val_lonlat=values(tbl,4) |
Next, read in the GRIB file containing the mean sea level forecast:
...
| Code Block |
|---|
p=read( data: g, step: (i-1)*2412, area : wbox ) |
Here we used the fact the forecasts steps are stored in hours units in the GRIB file.
...
| Code Block |
|---|
trVal= trVal & [vpmin/100] |
And also build the list of dates:
...