| Horizontal Navigation Bar | ||||||||||||||||||||||||||
|---|---|---|---|---|---|---|---|---|---|---|---|---|---|---|---|---|---|---|---|---|---|---|---|---|---|---|
|
Once the program is up:
Select “Servers” menu.
Next click on the "Manage Servers..." menu
"Add server" enter details of your ECF server.
You should also change the preferences to "Administrator" mode, which shows an enhanced set of menu options.
- In ecflow_ui: Select "Tools Menu:Preferences"
- Select Menus and change "menu mode" to "Administrator".
Choose a name for your ECF server and add the Host name and port number you noted down earlier. Make sure 'Add server to current view' is clicked on the dialog.
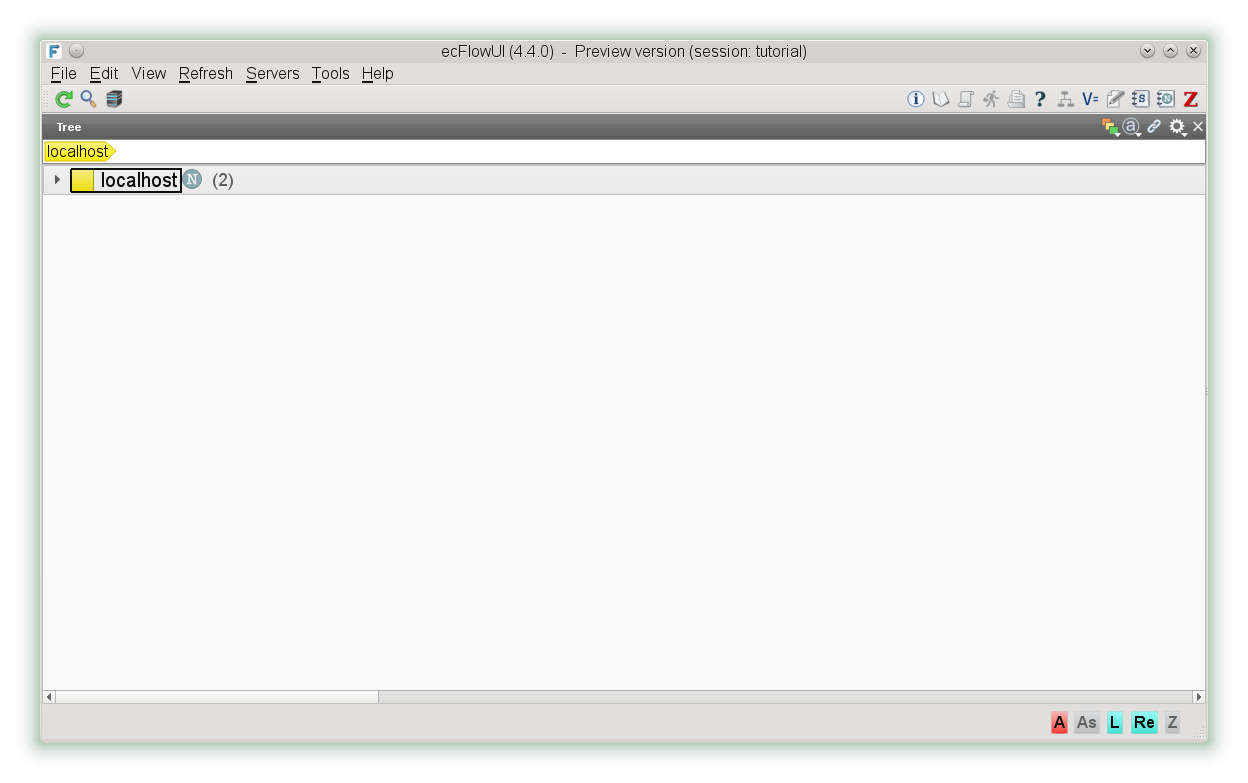
The yellow boxes are called nodes. With the left mouse button click on the black triangle. This will expand the node. Repeat for node called 'test'.
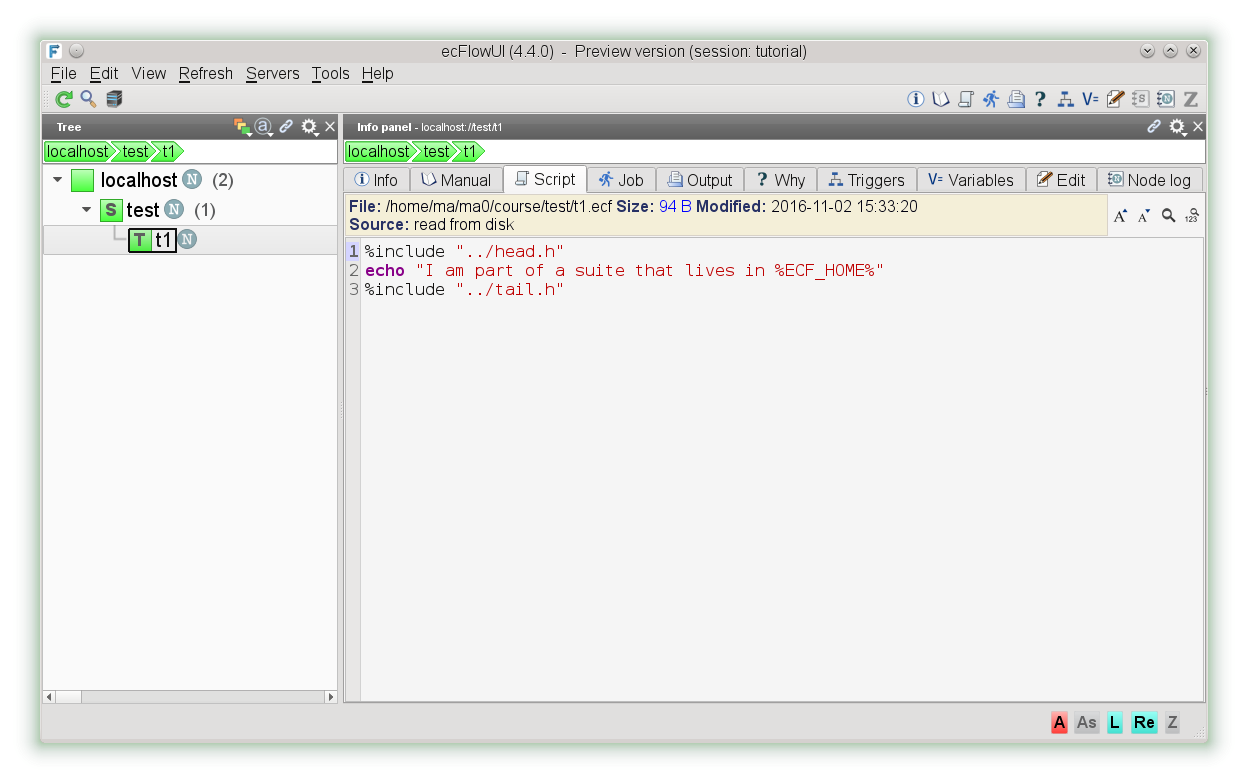
| Info |
|---|
S - stands for suite, F stands for Family, and T - stands for Task |

Now select the View menu and then "Add info panel". This panel can be re-arranged on the window.

If we want to rerun the suite, move the mouse pointer over test and click on the right mouse button and choose requeue.
We will now add a table view. This allows us to see additional attributes, when a node is selected. From the View menu, select "Add table view"

You will notice that selection in the tree view, selects the corresponding node in the table view.
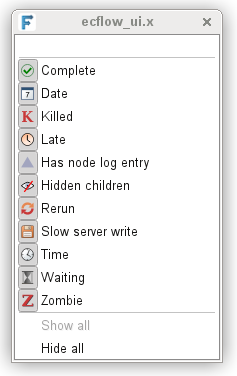
Task nodes contain a flag that can reflect the reason for its being aborted, complete, or submitted.
Here the associated icons that can be displayed in ecflow_ui
What to do
- Exploreecflow_ui menus and windows
- There can be a long delay between the job changing status and that change being reflected in the ecflow_ui window.
To update the current state more quickly in that window, click on the green icon(top left hand side), on the tool bar. (or F5)
| Horizontal Navigation Bar | ||||||||||||||||||||||||||
|---|---|---|---|---|---|---|---|---|---|---|---|---|---|---|---|---|---|---|---|---|---|---|---|---|---|---|
|