Here are some different ways that you can use Metview's Python interface. Make sure you have set up your environment first.
Text editor and command line
Perhaps the simplest - just use any text editor to edit the Python code and run it from the command line, e.g.
python3 my_metv_python_script.py
Python IDE
Python IDEs, such as PyCharm, provide an interactive environment and even debugging facilities.

Jupyter notebook
A Jupyter notebook provides an interactive workspace combining code, plots and documentation. It runs in a web browser and can be started from the command-line as follows:
jupyter notebook
This command will open a new tab in your web browser, or you can copy the URL yourself.
Now, create a new Notebook using the New menu and selecting Python 3:

You can start typing your code into the cells. Press CTRL-Return to execute the code in the current cell, or SHIFT-Return to execute and move to the next code cell. The Kernel menu allows the restart of a session. To generate plots inside the notebook, call
mv.setoutput('jupyter')
at some point before calling the plot() command. By default, plots will go to an interactive Metview plot window unless this is done.
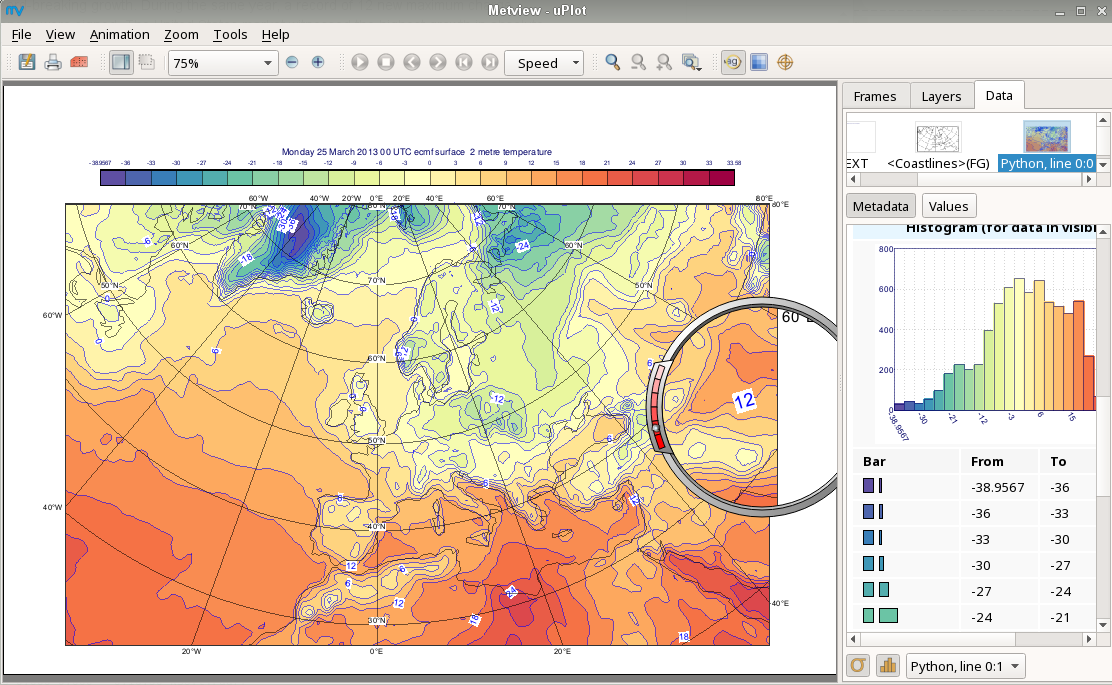
| mv.setoutput('jupyter') for inline plots | With no setoutput command, and interactive plot window |
|---|---|
|
|