
With this icon we can recreate the layers of the ecCharts web-based visualisation system in the Metview environment. The icon retrieves and the data making up an ecCharts layer for the selected date from the MARS archive then applies the required post-processing steps and visualises the result using one of the pre-defined ecCharts styles.
Output format
Please note that the output of the icon is not a single GRIB file but a list of the following items:
- the GRIB fields retrieved from MARS
- a plot title definition (see Text plotting icon)
- a contouring definition (see Contouring icon) using the specified the pre-defined style associated with the layer
- a legend (see Legend icon) definition
Saving GRIB data
To save a local copy of the retrieved GRIB data use the Save result action from the icon context menu.
Generating script code
The icon is equipped with the Generate Macro and Generate Python context menu actions.
![]()
With these actions the actual retrieval, post-processing and visualisation steps can be saved into the specified script format (the generated script will be appear in the current folder). Here is an example of the Macro code generated for layer t925.
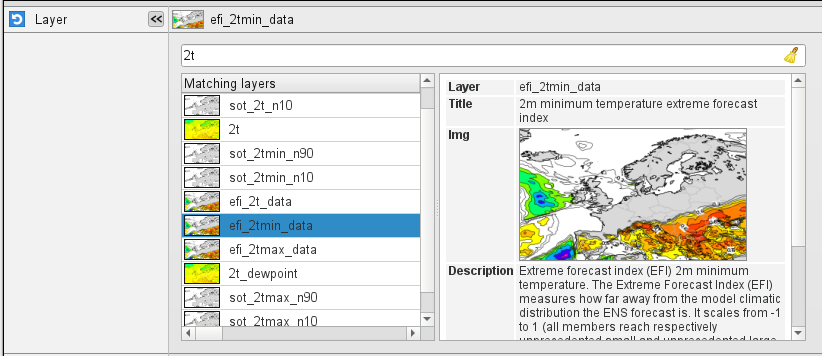
What layers are available?
A fair number of ecCharts layers are available but several layers are not yet added. The icon editor contains a layer browser where the available layers can be searched for and their various properties can be inspected in detail.
For help on editing icons, please see Editing Icons.
The macro language equivalent is eccharts().
The Eccharts Editor
YYYYMMDD format. Relative dates are allowed: e.g. -1 means yesterday, 0 means today, etc. Layer
Specifies the name of the Eccharts layer.
Style
Specifies the contouring style for the selected layer. Each Eccharts layer is associated with a group of predefined styles. When a given layer is selected in Layer the icon editor only shows the available styles for that layer and the default style is automatically selected.
Date
Specifies the run date of the forecast . This is the same Date parameter as in the MARS retrieval icon. The date is given in YYYYMMDD format. Relative dates are allowed: e.g. -1 means yesterday, 0 means today, etc. The default is -1.
Time
Specifies the run time of the forecast. This is the same Date parameter as in the MARS retrieval icon. The default is 0.
Step
Specifies the forecast steps in hours. Here a list of values is given.
Grid
Specifies the resolution of the resulting grid in dx/dy format, where dx is the grid increment in east-west direction, while dy is the grid increment in north-south direction (both in units of degrees). The default value is: 1/1.
Fail On Data Error
When this parameter is set to yes an error in the data retrieval or post-processing force the icon (or the Macro/Python script running it) to fail to fail.
Only data on and below this model level will be used to generate the FLEXPART input fields. This level can be specified either as a model level or as a pressure value. In the latter case FLEXPART Prepare will use the data retrieved for the first date to determine the topmost model level. The default value of this parameter is 1, which means that all the model levels will be used if Top Level Units is set to model_levels.
Top Level Units
Specifies the units of the value of Top Level. The allowed values are model_levels or hPa. The default value is model_levels.
Reuse Input
If this parameter is set on FLEXPART Prepare checks the existence of the data files to be generated and if they are already in place no new data is retrieved and processed. If it is off all the fields are always retrieved and processed and the existing data files are overwritten. The same happens to the AVAILABLE file. The existence of a FLEXPART input GRIB file is checked by using the file name and a set of ecCodes keys from the first message in the file. These keys are as follows: date, time, stepRange, gridType, iDirectionIncrement, jDirectionIncrement, latitudeOfFirstGridPoint, latitudeOfLastGridPoint, longitudeOfFirstGridPoint, longitudeOfLastGridPoint.
Output Path
Specifies the output directory (can be a relative or absolute path) where the GRIB files and the AVAILABLE file will be generated. If this directory does not exist Metview will create it. The output GRIB files have the following naming convention: ENyymmddh