Contributors: W. Preimesberger (WP, TU Wien), J. Lems (JL, TU Wien), D. Aberer (DA, TU Wien), A. Dostalova (AD, EODC), T. Frederikse (TF, Planet), W. Dorigo (WD, TU Wien),
Issued by: EODC GmbH/Alena Dostalova
Date: 07/11/2025
Ref: C3S2_313c_EODC_WP1-DDP-SSM-v1_202506_PQAR; C3S2_313c_EODC_WP1-DDP-RZSM-v1_202506_PQAR; C3S2_313c_EODC_WP1-DDP-FT-v1_202506_PQAR
Official reference number service contract: 2024/C3S2_313c_EODC/SC1
History of modifications
List of datasets covered by this document
Acronyms
General definitions
Active (soil moisture) retrieval: the process of modeling soil moisture from radar (scatterometer and synthetic aperture radar) measurements. The measurand of active microwave remote sensing systems is called “backscatter”.
Accuracy: The closeness of agreement between a measured quantity value and a true quantity value of a measurand ((JCGM), 2008). The metrics used here to represent accuracy are correlation and unbiased Root Mean Square Difference (ubRMSD). These metrics are commonly used throughout the scientific community as measures of accuracy (Entekhabi et al., 2010).
Backscatter is the measurand of “active” microwave remote sensing systems (radar). As the energy pulses emitted by the radar hit the surface, a scattering effect occurs and part of the energy is reflected. The received energy is called “backscatter”, with rough surfaces producing stronger signals than smooth surfaces. It comprises reflections from the soil surface layer (“surface scatter”), vegetation (“volume scatter”), and interactions of the two. Under very dry soil conditions, structural features in deeper soil layers can act as volume scatterers (“subsurface scattering”).
Bias : “Bias is defined as an estimate of the systematic measurement error.” (GCOS-200) (GCOS, 2016)
Break detection and correction: Additional processing step introduced in the Combined Soil Moisture product version v202312. The methods detect and correct inhomogeneties in the merged satellite records (breaks) that may occur as a result of merging different sensor combinations over time. More information is available in the product Algorithm Theoretical Basis Document (ATBD, Preimesberger et al., 2025b).
Breakthrough requirement: An Essential Climate Variable (ECV) requirement level set by Global Climate Observing System (GCOS) which “[…] if achieved, would result in a significant improvement for the targeted application […] at which specified uses within climate monitoring become possible. It may be appropriate to have different breakthrough values for different uses.” (GCOS-245) (GCOS, 2022)
Brightness Temperature is the measurand of “passive“ microwave remote sensing systems (radiometers). Brightness temperature (in degrees Kelvin) is a function of kinetic temperature and emissivity. Wet soils have a higher emissivity than dry soils and therefore a higher brightness temperature. Passive soil moisture retrieval uses this difference between kinetic temperature and brightness temperature, to model the amount of water available in the soil of the observed area while taking into account factors such as the water held by vegetation.
Dekad: the period or interval of 10 days
Error: “The term error refers to the deviation of a single measurement (estimate) from the true value of the quantity being measured (estimated), which is always unknown” (Gruber et al., 2020)
Fiducial Reference Measurements (FRM): Suite of independent, fully characterized, and traceable ground measurements that follow the guidelines outlined by the Group on Earth Observation (GEO) / Committee in Earth Observation Satellites (CEOS) Quality Assurance framework for Earth Observation (QA4EO).
Freeze/Thaw: refers to the state of soil moisture during a year. Water in the upper soil layer transitions within the soil between its liquid and solid (ice) states due to changes in temperature. When soil temperatures drop below freezing, liquid soil water turns into ice, altering the soil's dielectric properties, which is a key factor in microwave remote sensing of soil conditions. Conversely, as temperatures rise above freezing, the ice in the soil melts, reintroducing liquid water and activating various ecological and hydrological processes. The freeze/thaw cycle significantly influences energy, water, and mass exchanges between the land surface and the atmosphere, affecting surface runoff, plant growth, soil respiration, and other crucial environmental factors. In remote sensing, detecting these freeze/thaw states is important for accurately estimating soil moisture and understanding surface conditions. Frozen soil can be detected using changes in brightness temperature and backscatter observed by microwave sensors
Infiltration model: a mathematical tool used to simulate the rate at which water moves into the soil.
Key Performance Indicators (KPIs): A set of performance measures designed to rate the quality of satellite soil moisture observations. Based on suggestions from the Global Climate Observing System (GCOS), the Climate Modelling User Group (CMUG), and other community-agreed standards.
Koeppen-Geiger Climate Classification: Global classification of regions based on their climates. Contains 5 main classes with multiple sub-classes: A (tropical), B (arid), C (temperate), D (continental), and E (polar) climates. In the context of Copernicus Climate Change Service (C3S) soil moisture, the classification of Peel et al. (2007) is used.
Level 2 pre-processed (L2P): this is a designation of satellite data processing level. “Level 2” means geophysical variables derived from Level 1 source data on the same grid (typically the satellite swath projection). “Pre-processed” means ancillary data and metadata added following Group for High-Resolution Sea Surface Temperature (GHRSST) Data Specification.
Level 3 /uncollated/collated/super-collated (L3U/L3C/L3S): this is a designation of satellite data processing level. “Level 3” indicates that the satellite data is a geophysical quantity (retrieval) that has been averaged where data are available to a regular grid in time and space. “Uncollated” means L2 data granules have been remapped to a regular latitude/longitude grid without combining observations from multiple source files. L3U files will typically be “sparse” corresponding to a single satellite orbit. “Collated” means observations from multiple images/orbits from a single instrument combined into a space-time grid. A typical L3C file may contain all the observations from a single instrument in a 24-hour period. “Super-collated” indicates that (for those periods where more than one satellite data stream delivering the geophysical quantity has been available) the data from more than one satellite have been gridded together into a single grid-cell estimate, where relevant.
Passive (soil moisture) retrieval: the process of modeling soil moisture from radiometer measurements. The measurand of passive microwave remote sensing is called “brightness temperature”. The retrieval model in the context of C3S soil moisture is generally the Land Parameter Retrieval Model (LPRM).
Radiometer: Spaceborne radiometers are satellite-carried sensors that measure energy in the microwave domain emitted by the Earth. The observed quantity is called “brightness temperature” and depends on the kinetic temperature of an object and its emissivity. Due to the high emissivity of water compared to dry matter, radiometer measurements of the Earth’s surface contain information on the water content in the observed area.
Root-Zone: The (variable) layer of soil where plant roots grow and absorb water and nutrients. It typically extends from the soil surface to the maximum depth that roots can reach, and its characteristics — such as moisture, structure, and composition — are crucial for plant health and ecosystem functioning.
Root Zone Soil Moisture: Water content in the 0–1 m soil layer where most plant roots extract water, expressed as volumetric soil moisture (m³m-³).
Scatterometer: Spaceborne scatterometers are satellite-carried sensors that use microwave radars to measure the reflection or scattering effect produced by scanning a large area on the surface of the Earth. The initially submitted pulses of energy are reflected by the Earth’s surface depending on its geometrical and geophysical properties in the target area. The received energy is called “backscatter”. Soil moisture retrieval relies on the fact that wet soils have a higher reflectivity (and therefore backscatter) than dry soils due to the high dielectric constant of liquid water compared to dry matter.
Stability: “The change in bias over time” (GCOS-245) (GCOS, 2022). “Stability may be thought of as the extent to which the uncertainty of measurement remains constant with time. […] ‘Stability’ refer[s] to the maximum acceptable change in systematic error, usually per decade.” (GCOS-200) (GCOS, 2016)
Surface Soil Moisture: The water content in the surface layer. There is no common definition of the surface layer, but it is generally assumed to range between 0.02-0.05 m. It is given in volumetric soil moisture (m³m-³) or percentage of saturation (%).
Target requirement: ideal requirement which would result in a considerable improvement for the target application.
Threshold requirement: minimum requirement to be met to ensure data are useful.
Uncertainty: “Satellite soil moisture retrievals […] usually contain considerable systematic errors which, especially for model calibration and refinement, provide better insight when estimated separately from random errors. Therefore, we use the term bias to refer to systematic errors only and the term uncertainty to refer to random errors only, specifically to their standard deviation (or variance)” (Gruber et al., 2020)
Executive summary
This document is the Product Quality Assessment Report (PQAR) for products Copernicus Climate Change Service (C3S) satellite soil moisture products, produced by TU Wien, EODC, and Planet Labs from a large set of active and passive microwave remote sensing instruments. The C3S soil moisture (SM) product suite provides PASSIVE, ACTIVE, and COMBINED (passive + active) surface soil moisture (SSM) products, and a root-zone soil moisture (RZSM) product from microwave measurements on a daily, dekadal (10-days), and monthly basis. In addition, a daily soil moisture freeze/thaw (F/T) classification product based on active and passive microwave measurements is provided. All data are sampled on a regular 0.25-degree grid based on the World Geodetic System 1984 (WGS 84) reference system. Records are available globally between November 1978 and present-day (for PASSIVE, COMBINED, RZSM, and F/T) and between 1991 and present-day (for ACTIVE). For details about the products, we refer to the Product User Guide and Specification (PUGS, Preimesberger et al., 2025a).
This document presents the results of Quality Assessment activities that have been undertaken for the current Climate Data Record (CDR) product version v202505:
- Chapter 1.1 briefly describes the evaluated C3S satellite soil moisture products
- Chapter 1.2 introduces the reference datasets used for validation
- Chapter 1.3 describes the methodology for the evaluation of the surface and root-zone soil moisture products. This includes the validation platform / software used, and the computed performance metrics.
- Chapter 1.4 describes the methodology for the evaluation of the freeze/thaw products.
- Chapter 2.1 contains the results of the surface and root-zone soil moisture quality assessment
- Chapter 2.2 contains the results of the freeze/thaw classification quality assessment
- Chapter 3 and Chapter 4 contain references to example applications
- Chapter 5 puts the validation results into context with the predefined user requirements, to assess to what degree the Key Performance Indicators (KPIs) set for the product are met.
The focus here is on the COMBINED product, which is recommended for most users. The Interim Climate Data Records (ICDR) are currently not assessed. However, note that to achieve maximum consistency between CDR and ICDR, both products use the same Level 2 products (based on Near Real Time (NRT) data streams) and merging algorithms and thus have very similar quality characteristics.
Summary of the coverage assessment: The new ASCAT version used for the first time has affected the coverage of the ACTIVE product significantly, as expected. Arid regions contain fewer measurements now (due to the masking of areas potentially affected by subsurface scattering). The cross-flagging of input measurements has aso led to a reduced coverage in the COMBINED and PASSIVE product in some regions. In the pre-2007 era some individually missing pixels were found. The underlying cause will be investigated and the data should be restored in future versions of the product. The added observations from daytime satellite overpasses of operational sensors led to an improved coverage over the last years.
Summary of the soil moisture accuracy assessment: In general, there is a variability in the global correlations in the three C3S SSM products, with correlations ranging from 0.4 to above 0.8; depending on the conditions and the locations of the in situ stations used. The unbiased Root Mean Square Difference (ubRMSD), which can be directly taken as a measure of accuracy, is demonstrated to be below 0.10 m3/m3 for all the different conditions analyzed and often below the GCOS target requirement of 0.04 m3/m3. Therefore, the KPIs for accuracy have been met. Compared to previous versions of C3S SSM, v202505 shows a slightly better agreement with in situ measurements. The C3S root-zone product performs similarly well in the comparison to in situ measurements, especially in the 0-10 cm layer. The performance decreases slightly for deeper layers, particularly for the 40-100 cm layer.
Summary of the soil moisture stability assessment: The stability of the C3S product has been assessed in terms of the change in accuracy (when compared to International Soil Moisture Network (ISMN) measurements). The accuracy between the products (ubRMSD) has been calculated per year, as well as trends in the median yearly accuracy. The KPI threshold for stability of 0.02 m³/m³/decade is met when assessed using this method for more than 80% of tested locations. The breakthrough threshold (0.01 m³/m³/decade) is met for the majority of tested locations. The performance of the root-zone soil moisture product is on a par with the surface product in terms of dataset stability.
Summary of the soil moisture trend assessment: Recent changes applied by Eumetsat to the H SAF ASCAT SSM data record (which is one of the input data streams of C3S SM) have led to significant changes in long-term trends. Previously detected quasi-global (artificial) wetting trends were mitigated. However, there are still discrepances in long-term (1992-2024) trends between the three products, indicating intercalibration is still insufficient and/or affected by systematic differences between products (e.g. temporal coverage).
Summary of the soil moisture uncertainty assessment: Intra-annual signal-to-noise ratio estimates for all sensors indicate different performance levels depending on the sensor type/frequency band, land cover and seasonal effects (e.g, vegetation dynamics). Consequently, the uncertainty fields in the output products show a similar temporal behavior.
Summary of the freeze/thaw accuracy assessment: The F/T dataset shows stronger agreement with ERA5-Land than with ISMN. Against ERA5-Land, it correctly classified 92% of all cases, with a moderate False Discovery Rate (FDR) (17%) indicating some over-flagging of frozen conditions, and a very low False Omission Rate (FOR) (3%), meaning few missed frozen cases. In contrast, the validation against ISMN yielded lower accuracies and much higher FDR values. This highlights regional challenges in frozen/thawed detection, while suggesting that globally the dataset performs well but tends to overestimate frozen conditions.
The main algorithmic updates in v202505 are:
- The RZSM and F/T products were included for the first time
- Daytime measurements for AMSR2, GPM, SMAP and SMOS are now included in all products
- A new version of HSAF ASCAT A/B/C SSM (H121), with an artificial wetting trend correction was used
Detected issues:
- A data gap was found in southern Alaska due to a processing error. The gap was filled in all products before publication on Climate Data Store (CDS) but is visible in some validation results.
- A slight decrease in data coverage in all products was found due to missing data in some locations mostly around water bodies. This is considered a minor issue and probably related to the new ASCAT version used, but will be revised in the next CDR.
Product validation methodology
C3S Satellite Soil Moisture Products
A detailed description of the product generation of C3S v202505 is provided in the Algorithm Theoretical Basis Document (ATBD, Preimesberger et al., 2025b) with further information on the product given in the PUGS (Preimesberger et al., 2025a). The underlying algorithm is based on that of the publicly released European Space Agency (ESA) Climate Change Initiative (CCI) version 9.1 dataset, which is described in Plummer et al. (2017), Wagner et al. (2012), Liu et al. (2012), Dorigo et al. (2017), Gruber et al. (2019) and Hirschi et al., (2024) and available at https://archive.ceda.ac.uk/ and TU Wien science data. In addition, detailed provenance traceability information can be found in the NetCDF file metadata of any product.
The C3S satellite soil moisture (SM) service provides 5 products that describe 4 variables:
- Absolute (volumetric) surface soil moisture (SSM) (COMBINED and PASSIVE product)
- Surface soil moisture degree of saturation (ACTIVE product)
- Absolute (volumetric) root zone soil moisture (RZSM) (RZSM product)
- Freeze/Thaw (F/T) soil moisture classification (F/T product)
Products 1-3 are provided as daily, 10-daily, and monthly averaged fields. Product 4 is only available at daily sampling.
Two types of satellite sensors are used:
1) Satellite Radiometers (PASSIVE, COMBINED, RZSM, and F/T product)
- Scanning Multichannel Microwave Radiometer (SMMR) (inactive)
- 3x Special Sensor Microwave Imager (SSM/I): F08, F11, and F13 (all inactive)
- Tropical Rainfall Measuring Mission Microwave Imager (TMI) (inactive)
- Advanced Microwave Scanning Radiometer-Earth Observing System (AMSR-E) (inactive)
- Windsat Polarimetric Radiometer (inactive)
- Soil Moisture and Ocean Salinity (SMOS) Microwave Imaging Radiometer using Aperture Synthesis (MIRAS) (operational)
- 3x Feng-Yun (FY) Microwave Radiation Imager: FY-3B (inactive), FY-3C (inactive), and FY-3D (operational)
- Advanced Microwave Scanning Radiometer 2 (AMSR2) (operational)
- Global Precipitation Measurement Mission (GPM) (operational)
- Soil Moisture Active and Passive mission (SMAP) (operational)
2) Satellite Scatterometers (ACTIVE, COMBINED, RZSM, and F/T product)
- 2x Active Microwave Instrument (AMI) on European Remote Sensing Satellites (ERS) ERS-1 and -2 (both inactive)
- 3x Advanced SCATterometer (ASCAT) onboard the Meteorological Operational Satellites MetOp-A (inactive), -B, and -C (both operational)
The HSAF ASCAT SSM product mentioned in some parts of this report is developed and provided by HSAF and directly used by C3S SM. No retrieval of soil moisture from radar measurements is carried out within C3S.
The COMBINED, RZSM, and F/T products merge data from all above (active and passive) systems into a single harmonized record to maximize data quality and coverage. The period, over which each sensor is used, is shown in Figure 1. The PASSIVE and ACTIVE surface SM products rely only on radiometer and scatterometer measurements, respectively (red and blue sensor names in Figure 1).
All data are sampled on a regular 0.25-degree grid. Coordinates (longitude, latitude) refer to the WGS 84 reference system. The product is available globally between November 1978 and present-day (COMBINED, PASSIVE, RZSM, F/T) and between 1991 and present-day (ACTIVE). Data files are provided in NetCDF-4 image format and comply with CF Metadata conventions for climate netCDF data.
It is noted that, to achieve maximum consistency between Climate Data Record (CDR) and Interim Climate Data Record (ICDR), both products use the same Level 1 / Level 3 Near Real Time (NRT) input data streams and are therefore consistent in time and have very similar quality characteristics.

Figure 1. Sensors and merging periods for the C3S soil moisture product (ACTIVE, PASSIVE, COMBINED, RZSM, F/T) version v202505. Radiometer names are shown in red, scatterometers in blue. Letters beside the sensor/satellite names indicate the observation frequency band(s). Sensors highlighted with cross on the right side of the figure were not used for the F/T retrieval.
F/T Sensors
SMAP, SMOS, and ASCAT are currently not used for the F/T product, as the current retrieval models cannot derive surface state indicators from measurements of these sensors/frequency bands.
Parameters and Units
The C3S soil moisture products are provided along with associated uncertainties (for the daily product only) and additional ancillary data (such as flags for quality or observation mode).
The surface products (SSM and F/T) are representative of the first ~5 cm of soil. However, this is variable and depends on several factors such as soil properties (physical and dielectric) or the characteristics of the sensors used to estimate the data. Therefore, there is no information available in the product about the exact retrieval depth. The RZSM product has been calibrated for three depth layers (Pasik et al., 2023), which are provided as separate fields in the data files: 0-10 cm, 10-40 cm, 40-100 cm. In addition, one field for the 0-1 m layer is provided via a weighted (by layer width) average of layers 1-3.
For the COMBINED, PASSIVE and RZSM products, soil moisture is provided in units of [m3 / m3] (volumetric soil moisture, SMvol). For the active product, soil moisture is expressed as "degree of saturation" [%], (SM%sat)
This difference in units is due to the different retrieval algorithms used to derive soil moisture from active (Wagner et al., 1999) and passive sensors (Owe et al., 2008) , respectively the scaling to Global Land Data Assimilation System (GLDAS) Noah (Rodell et al., 2004) soil moisture in the COMBINED product (Dorigo et al., 2017) . Volumetric soil porosity (Porosityvol) information may be used to convert between (relative) saturation and volumetric units for soil moisture (Hillel, 2003):
Validation Reference Data
Indpendent in situ and reanalysis reference datasets are utilized to assess the quality of the C3S satellite soil moisture products.
In situ measurements from the International Soil Moisture Network (ISMN)
This ISMN1 is a database initiated by TU Wien and now hosted by the German Federal Institute of Hydrology (BfG). It is a global collection of publicly available in situ soil moisture measurements from operational networks and validation campaigns. In situ data are gathered from the individual network providers, harmonized, and made available to the platform users (Dorigo et al. 2021) and the geo-scientific community. The main purpose is to validate and improve global satellite observations and modeled products. Data within the ISMN are subject to quality controls and provided with quality flags (Dorigo et al. 2013). The quality controls include an assessment against a possible range of important metrological variables which are applied equally to all datasets. The temporal coverage throughout a year and the time series length vary largely between stations. Often there are multiple soil moisture sensors present at a station in similar depths.
A snapshot of the full ISMN archive was downloaded in June 2025. This snapshot contains in total 16408 soil moisture time series from sensors at 3240 stations (maintained by 85 networks) in the top 1 m of soil. Figure 2 shows sensors in the top 10 cm of soil as of March 2024.
For the validation of the RZSM product, we use all available sensors in the corresponding depth layer, i.e., up to 5523 sensors at 0-10 cm, up to 6854 sensor at 10-40 cm, and up to 4545 sensors at 40-100 cm depth. Note that some in situ sensors are installed vertically to measure a depth profile, and therefore might fall into multiple categories.

Figure 2. ISMN stations (as of March 2024) and probe count in 0-10 cm depth. Locations with 1 (top left), 2 (top right), 3-6 (bottom left), and >7 (bottom right) soil moisture sensors are shown separately.
ISMN stations are organized in regional networks and therefore distributed unevenly globally. Most measurements are taken within the continental United States, Europe and E-Asia. Validation results are therefore only representative of the environmental regimes covered by these stations (temperate climates) and mostly exclude (sub)equatorial and (sub)polar regions, highly organic soils as well as deserts. Therefore, validation results will be stratified for different environmental classes:
- In situ sensor depth levels
- Aggregated soil texture classes (by sand/clay/silt content and soil organic content), respectively granularity.
- Aggregated ESA CCI Land Cover classes.
ISMN Fiducial Reference Measurements
As part of ESA's Fiducial Reference Measurements for Soil Moisture (FRM4SM) project (resource validated 29th July 2025), a quality index for the "representativeness" of each in situ time series for the satellite surface soil moisture data at radiometer scale (~25 km) was produced from the time series length and the Triple Collocation Analysis (TCA) based Signal-to-Noise Ratio (SNR). Sufficiently long time series with a high SNR (>3 dB) at 95% confidence are classified as "very representative" or "representative". Applying this quality indicator to all ISMN time series results in a subset of 1873 high-quality sensor time series of the full dataset described above. However, as only sensors in the top 10 cm are classified (their location is shown in Figure 3), the so-found subset can only be applied for the evaluation of the SSM products.

Figure 3. Subset of the ISMN database to include "very representative" and "representative" surface layer (0-10 cm) measurements. Based on the FRM4SM quality indicator. Note that points in the graphic often overlap due to regional network clustering. An interactive overview map is available at https://ismn.earth/en/dataviewer/ (last access: 23 October 2025)
ERA5-Land
ERA5-Land (Muñoz-Sabater et al. 2021), produced by ECMWF, is a global reanalysis available from 1950 to present (with a few days delay). It provides surface variables with an increased spatial resolution compared to ERA5 (Hersbach et al. 2020). Soil Moisture in ERA5-Land is available in 1-hour intervals on a ~9 km grid and without temporal gaps. ERA5-Land provides various (land) variables, such as soil moisture ("swvlX") or soil temperature ("stlX"), where X stands for one of four soil layers (1 at 0-7 cm depth, 2 at 7-28 cm, 3 at 28-100 cm, and 4 at 100-289 cm).
Here we use ERA5-Land data from 1981 to 2024 extracted at hours 0, 6, 12, and 18 of each day. Data from ERA5-Land layer 1 is used for comparison to the C3S SSM products. For the validation of the RZSM products, we also use layers 2 and 3 of ERA5-Land accordingly. Soil temperature information of each layer is used to mask observations before validation (when stlX is below 0°C) to eliminate the potential impact of remaining outliers in the satellite data at the transition from liquid to frozen soil moisture. ERA5-Land stl1 data with a 0 °C threshold is also used to assess the accuracy of the C3S satellite soil moisture Freeze/Thaw product, assuming that soil moisture is correctly classified as "frozen" when the daily average soil temperature is below 0 °C.
ERA5-Land can be downloaded directly through the Copernicus Climate Data Store. Documentation available online. (Resources validated 3rd September 2025).
Soil moisture validation methods
Introduction
The evaluation of C3S Soil Moisture (surface and root-zone) products includes:
- Completeness and consistency checking to demonstrate the continuous nature of the product over the spatial and temporal domains. This includes evaluation of the number of valid observations available in the dataset.
- Accuracy assessment of the data product, i.e. validation defined by the Land Product Validation (LPV) group as "the process of assessing, by independent means, the quality of the data products derived from the system outputs" (also see Justice et al., 2000). The LPV group is a sub-group of the Committee for Earth Observation Satellites (CEOS).
- Comparison to previous products includes an assessment of the dataset against previously released C3S versions to show the evolution of the algorithm over time.
- Stability assessment of the product over long time periods. This refers to biases in the product remaining constant in time and has been defined for Earth Observation applications (GCOS, 2022) as the extent to which the systematic error associated with the product changes.
- Visual inspection of the dataset, which includes plotting maps and time series of the data to allow a check on the spatial and temporal characteristics of the dataset to ensure they are as expected.
- Uncertainty assessment provides plots of the uncertainties associated with the product.
A similar assessment methodology to that presented here has been previously utilized in the ESA CCI soil moisture project (Hirschi et al., 2024, Mittelbach et al., 2012). This validation methodology was subject to user community acceptance prior to use and as such, it allowed a contribution to the definition of international standards in the soil moisture domain.
Factors affecting soil moisture retrieval quality
Quality Assurance (QA) of soil moisture datasets is important as quality of individual soil moisture observations can be impacted by numerous factors (Dorigo et al., 2017). These factors can be roughly divided into the following categories: (i) sensor properties, (ii) orbital characteristics, (iii) environmental conditions, (iv) algorithm skill (e.g. methods used to correct for vegetation impacts) and (v) post-processing (e.g. resampling). Further details of each of these characteristics are provided in Table 1. The majority of these factors add some degree of random error and bias to the obtained estimate (Dorigo et al., 2017) .
Table 1. Main sensor, observational and environmental factors impacting the quality of the C3S soil moisture products. Taken from Dorigo et al. (2017).
Factor | Category | Affects active (A) or passive (P) observations | Impact on soil moisture retrieval | How it is handled in the C3S product and potential recommendation(s) for use |
|---|---|---|---|---|
Observation frequency / wavelength | Sensor | A, P | Shorter wavelengths (higher frequencies) are more sensitive to vegetation, theoretically causing higher errors. Different wavelengths have different soil penetration depths, and thus represent different surface soil moisture columns. | Preferential use of longer wavelengths when multiple frequencies are available. Indirectly accounted for by Signal to Noise Ratio (SNR)-based weighting and indirectly quantified as part of the random error estimate (see below). The frequency and sensor that were used in the product generation are provided as ancillary data. |
Instrument errors and noise | Sensor | A, P | Directly impacts the error of the single-sensor soil moisture retrieval. | Included in total random error assessed by triple collocation. Soil moisture random error provided as a separate variable in product. |
Local incidence angle and azimuth | Sensor | A | Impacts backscatter signal strength and hence retrieved value. | Accounted for by incidence angle and azimuthal correction in Level 2 retrieval. Remaining uncertainty is indirectly quantified as part of random error estimate. |
Local observation time | Orbital | A, P | Vegetation water content changes during the day (Steele-Dunne et al., 2012), but this variability is not accounted for by the retrieval models. Early morning observations may be influenced by dew on soil and vegetation, thus leading to higher observed soil moisture. Solar irradiation causes discrepancies between canopy and soil temperatures which complicate the retrieval of soil moisture (Parinussa et al., 2016); see also "Land surface temperature" below. Intra-daily variations because of convective precipitation and successive evaporation may be missed. | Partly addressed by separately estimating random errors in "night-time" and "day-time" radiometer observations. |
Vegetation cover | Environmental | A, P | Reduces signal strength from soil and hence increases uncertainty of soil moisture retrieval. | Included in total random error of product assessed by triple collocation. Dense vegetation is masked for passive Level 2 products according to sensor-specific Vegetation Optical Depth (VOD) thresholds: soil moisture random error is provided as a separate variable. |
Topography | Environmental | A, P | Impacts backscatter signal strength; causes heterogeneous soil moisture conditions within the footprint. | Not accounted for. Topography index is provided as metadata. A flagging of pixels with topography index > 10 % by the data user is recommended. |
Open water | Environmental | A, P | Impacts backscatter and brightness temperature signal strength. | Not accounted for. Open water fraction is provided as metadata. A flagging of pixels with open water fraction > 10 % by the data user is recommended. |
Urban areas, infrastructure | Environmental | A, P | Impacts backscatter and brightness temperature signal strength. | Not directly account for. Uncertainty is indirectly quantified as part of random error estimate. |
Frozen soil water | Environmental | A, P | Strongly impacts observed backscatter / brightness temperatures causing a "false" reduction in soil moisture. | Masked using radiometer-based land surface temperature observations (Holmes et al. (2009), van der Vliet et al. (2020)) and freeze / thaw detection (Naeimi et al., 2012) from Level 2 algorithms. Flag provided as metadata. |
Dry soil scattering | Environmental | A | Volume scattering causes unrealistic rises in retrieved soil moisture (Wagner et al., 2023). | Not directly accounted for in ERS, but indirectly accounted for by low weight (related to high error) received in SNR-based blending. Accounted for in ASCAT by excluding measurements with a subsurface scattering probability above 10% (probabilities provided by H SAF with ASCAT SSM). |
Land surface temperature | Environmental | P | Errors in land surface temperature directly impact the quality of surface soil moisture retrievals. | Partly addressed by separately estimating random errors in "night-time" and "day-time" radiometer observations. |
Landcover changes | Environmental | A, P | Signficant (structural) changes in land cover can affect the retrieval of soil moisture if they drastically change compared to the state when the retrieval model was parameterized (e.g., desertification, urbanization, deforestation, flooding, etc.) | Partly addressed by adequate flagging of unreliable measurements, recalibration of retrieval algorithms, use of dynamic landcover information. |
Radio frequency interference (passive only) | Environmental | P | Artificially emitted radiance increases brightness temperatures and, hence, leads to a dry bias in retrieved soil moisture. | In the case of multi-frequency radiometers, a higher frequency channel (e.g. X-band) is used ifradio frequency interference (RFI) is detected. In other cases, the observation is masked. |
Validation framework
The methods for quality assessment of biogeophysical variables have been developed over several decades and there is significant research available on good practices and techniques (Loew et al., 2017; Gruber et al., 2020). The available guidance is taken into account within the methodology. This is complemented by the development of the Quality Assurance for Soil Moisture (QA4SM)2 platform, which provides robust, traceable validation of different data products against reference data including ISMN and ERA5-Land. QA4SM is being developed as part of ESA's FRM4SM program. The goal of this platform is to implement (scientific) best practices for soil moisture validation in an easy to use web application, including state-of-the-art reference data (such as ERA5-Land or ISMN, or various satellite products from SMAP, SMOS, ASCAT, ESA CCI, Sentinel-1 etc.) and free (cloud) processing resources to perform the traceable assessments of (user-uploaded) soil moisture data records. C3S v202505 SSM and RZSM data is available online for all users of the service (data files cannot be downloaded).
Validation results produced using the QA4SM service have a permalink assigned. This redirects users to archived, traceable, citable results on the Zenodo platform3. The relevant links are given in each chapter. The used QA4SM version was v3.1.0.1 (released 2025-05-13).
Pre-processing
To calculate the metrics for each assessment, the settings summarized in Table 2 are used. The datasets are spatially and temporally matched, filtered for high-quality observations, and the C3S data are scaled to the ISMN data using mean/standard deviation scaling. The metrics are then calculated using all available observations in the period 1978-11-01 to 2024-12-31.
Table 2. Settings used in the assessment of the daily C3S soil moisture product against the ISMN
Setting | Details |
|---|---|
Temporal Matching |
|
Spatial Matching | For all comparisons to in situ observations, the nearest C3S (and ERA5-Land) grid cell is found using the longitude/latitude of the ISMN station metadata. Only data from the nearest grid cell within a radius of <30 km around an in situ station are considered. |
Scaling | The default approach is to remove additive and multiplicative biases between datasets due to spatial scale mismatch using a mean/standard deviation scaling approach (Gruber et al., 2020). In situ measurements are scaled, the C3S SM data is left unchanged (scaling reference). Correlation scores are not affected by this scaling step, ubRMSD values are usually slightly lower when computed from scaled compared to unscaled values. This is because not only the first statistical moment (mean) is matched (bias removal), but also the second (variance). This step essentially also converts the ACTIVE product from % saturation to volumetric units. |
Filters |
|
Anomalies | Anomalies are computed by subtracting the long-term multi-year average (climatology) from the measurements. The climatological reference period is over the years 1990 to 2020. |
Depth selection | The representative depth of satellite, in situ and reanalysis soil moisture varies. For the surface soil moisture products, comparisons are performed against in situ probes in the first 10 cm and the top layer of ERA5-Land (in line with Hirschi et al., 2024). For the root-zone product, we choose in situ probes in the respective depth layers (10-40, 40-100 cm) and the best matching layer of ERA5-Land (7-28, 28-100 cm). |
Accuracy metrics
The two main performance metrics evaluated here are the Pearson correlation coefficient (R) and the unbiased Root Mean Square Difference (ubRMSD). These are commonly used metrics to describe the temporal agreement and accuracy between two datasets (Gruber et al., 2020). For more details on the computation of the metrics, we refer to Gruber et al. (2020) as well as the QA4SM User Manual, which describes not only the metrics but also the pre-processing steps performed by QA4SM in detail.
Pearson's R
The correlation of the two time series as expressed by covariance normalized over the two respective standard deviations
where the bar accent indicates the sample mean:
and Sigma indicates the standard deviation, defined for X as
The statistical significance of the correlation value, defined by a Student’s t test with a threshold of 95% and dependent on the number of points in the two samples, is defined with the p-value.
Unbiased Root Mean Squared Difference
As mentioned in the previous chapter, a scaling step is performed before computation of the metrics. This means that the bias between the compared samples will already be removed when the ubRMSD is computed. Therefore the ubRMSD in this case is equal to the RMSD. However, to highlight this aspect, we still refer to the RMSD as "unbiased" here.
where Yi X refers to the unbiased quantity of Yi , where values of Y were previously scaled to X to remove any (additive and multiplicative) biases between them.
Stability metrics
The stability of ECV products is a topic of research and the development of metrics, which describe stability in terms of change in the uncertainty of the variable of interest per decade, is ongoing.
To monitor stability, inter-annual accuracy metrics are calculated for the C3S data compared against ISMN on a per-year basis. Linear change (trends) over time in the metrics are then used as a measure of the stability of the product. In practice, we calculate Theil-Sen slope estimates from the annual ubRMSD values over time at each station.
The Theil-Sen slope estimator is defined as the median of all slopes (sij), from any available pair of observations (xi, yi ) and (xj, yj ), where i<j.
The Theil-Sen estimator is less sensitive to outliers compared to ordinary least squares regression. This makes it a reliable measure of temporal changes in the selected metrics, as it robustly captures systematic trends over time.
Freeze/Thaw validation methods
The freeze/thaw (F/T) time series has been validated against two reference datasets: in situ measurements from the ISMN and reanalysis data from ERA5-Land:
- The validation utilised ISMN soil_temperature data up to 10 cm. For each day, the daily minimum temperature was extracted. A threshold of 0 °C was applied to the ISMN in situ temperature time series to classify freeze/thaw conditions: Temperatures below 0 °C were classified as frozen. Pixels where classified as unfrozen when the temperature was above 0 °C.
- The validation utilised the ERA5-Land top layer soil temperature layer (stl1), which represents the topsoil level temperature. For each day, the daily minimum temperature was extracted. A threshold of 273.15 K (0 °C) was applied: If the minimum temperature was below 273.15 K, the day was classified as frozen.
The F/T time series are validated for all data points where they overlap (Table 3).
Table 3. F/T validation periods overview
Dataset | Time from | Time to |
F/T | 1978-11-01 | 2024-12-31 |
ISMN | 1988-06-01 | 2024-03-14 |
ERA5-Land | 1981-01-01 | 2024-12-31 |
For each location and at a global level, the following classification metrics were calculated:
Accuracy (ACC): The proportion of correct freeze/thaw classifications compared to the reference data. A higher accuracy indicates better overall agreement.
False Discovery Rate (FDR): The proportion of points incorrectly classified as frozen among all points classified as frozen. A lower FDR indicates fewer false positives.
False Omission Rate (FOR): The proportion of points incorrectly classified as thawed among all points classified as thawed. A lower FOR indicates fewer false negatives.
Validation results
Soil Moisture validation results
The quality assessment includes the following:
- Assessment of the spatial and temporal completeness of the daily soil moisture products (Section 2.1.1)
- A comparison of differences in the soil moisture fields compared to the previous version (Section 2.1.2)
- A time series comparison at selected locations with regard to the previous version (Section 2.1.3)
- A comparison of global statistics with regard to the previous version (Section 2.1.4)
- Accuracy assessment against in situ soil moisture observations from the ISMN (Section 2.1.5)
- Accuracy assessment against ERA5-Land reanalysis soil moisture (Section 2.1.6)
- Stability analysis through monitoring of long-term accuracy trends (Section 2.1.7)
- Analysis of the uncertainty information provided with the dataset (Section 2.1.8)
- Evaluation of the ACTIVE and PASSIVE products (Section 2.1.9)
- Evaluation of the root-zone dataset layers (Section 2.1.10)
Annex A : Contains a brief discussion on the differences between satellite and reanalysis soil moisture products and their applications.
An in-depth assessment of the previous dataset version (released in 2024) may be found in the PQAR document for v202312 (Preimesberger et al., 2024).
Spatial and temporal completeness
It is important to consider the spatial and temporal completeness and consistency of the product as these can be the key deciding factors for the users in terms of whether the product is suitable for their application.
The spatial and temporal coverage of the product is presented in terms of the number of available, valid daily observations. The highest coverage is expected in equatorial regions (due to the orbital paths of the satellites resulting in higher coverage), large parts of the southern hemisphere, India, and parts of the contiguous US and Europe. Lower data coverage is expected for regions affected by (seasonal) soil moisture freeze-thaw processes, mountainous areas, deserts, and areas affected by Radio Frequency Interference (RFI). Ice sheets and areas covered by rainforests are permanently masked in all C3S SM products.
COMBINED surface SM product
Figure 4 shows temporal/spatial aggregated v202505 absolute soil moisture. Permanent gaps (tropics and ice sheets) in the dataset and (climatological) differences in global soil moisture distribution are clearly visible.
(a) |
(b) |


Figure 4. C3S v202505 COMBINED Soil Moisture (full period), average over all days by grid cell (a) and by latitude/month (b).
Figure 5 shows the data coverage of the v202505 COMBINED product, with the expected spatial and temporal patterns. Coverage increased over time, as more satellites suitable for measuring SM became available, and significantly improved with the addition of AMSR-E in 2002 and ASCAT in 2007. In some areas, almost full daily coverage has been achieved in recent years.
(a) |
(b) |


Figure 5. Data coverage of the C3S SM v202505 COMBINED product over land (excl. Antarctica) for the full period (1978-11 to 2024-12).
Expressed as a percentage of the total number of days per period, (a) over the full period, (b) per month.
Figure 6 shows the comparison to the previous version (v202312) in terms of observation coverage. The overall coverage decreased slightly. This is mainly the case in regions with a generally weak soil moisture signal (deserts and summer months), which are masked out in the new ASCAT retrievals due to the potential superposition of subsurface scattering signals over the (weak or absent) soil moisture signal. The remaining regions are flagged in C3S SM accordingly. SM in deserts is considered unreliable, e.g. due to sub-surface scattering effects (Wagner et al., 2023).
While the reduced coverage in the pre-2007 period is unexpected and likely indicates some lost, previously valid data points, especially in coastal regions and around water bodies, we don't consider it a critical error. However, for future releases it is required to restore these values, even if it could slightly reduce the overall dataset accuracy.
(a) |
(b) |


Figure 6. Change in fractional data coverage of the COMBINED product between v202312 and v202505 by grid cell (a) and by latitude/month (b).
ACTIVE surface SM product
Figure 7 shows averaged soil moisture from the v202505 ACTIVE product (in % saturation). The ACTIVE product is scaled from 0 (historically lowest) to 100 (highest) percent saturation, meaning that values from 0 to 100 percent are expected in the product.
|
|


Figure 7. C3S v202505 ACTIVE Soil Moisture (full period), average over all days by grid cell (a) and by latitude/month (b).
The data coverage over time is shown in Figure 8. Compared to COMBINED, ACTIVE has an overall lower data coverage (fewer sensors), especially in the pre-ASCAT era (before 2007). Global gaps are found in the period between March and July 2003, in which no ERS data is available. ASCAT-B was introduced in 2012, and ASCAT-A was decommissioned in November 2021, which are noticeable in the time series plot.
Fig. 8a shows that additional permanent gaps are found in some regions (deserts). This is in line with the underlying ESA CC SM v09.1 data and related to the seasonal triple collocation estimates and the new subsurface scattering flag that was applied to all ASCAT data.
|
|


Figure 8. Data coverage of the C3S SM v202312 ACTIVE product over land (excl. Antarctica) for the full period (1991-08 to 2024-12).
Expressed as a percentage of the total number of days per period, (a) over the full period, (b) per month.
Compare to the previous version (v202312) there are large differences found in the product (Figure 9). This is expected as the ASCAT data stream used by C3S SM was updated to a more recent version (H121), which comes with various changes. All measurements were re-processed, the original grid and land mask were changed, and additional filtering was applied. However, regions that are most relevant for soil moisture studies such as Europe, the US or South-East Asia show an increase in data coverage.
|
|


Figure 9. Change in fractional data coverage of the ACTIVE product between v202312 and v202505.
PASSIVE surface SM product
The mean absolute values of the PASSIVE v202505 product are shown in Figure 10. The spatial patterns resemble the COMBINED product, which is driven by the (higher number of) passive sensors. However, while the COMBINED product is scaled to GLDAS Noah model soil moisture, which affects the spatial patterns of absolute soil moisture, PASSIVE is scaled to AMSR-E, which shows more spatial details, leading to a less smooth appearance.
(a) |
|


Figure 10. C3S v202505 PASSIVE Soil Moisture (full period), averaged over all days by grid cell (a) and by latitude/month (b).
Figure 11 shows the coverage of PASSIVE C3S SM. As expected, patterns are similar to the COMBINED product, but overall coverage is slightly lower. Compared to ACTIVE, fewer permanent gaps are found in deserts, although coverage is still low.
(a) |
(b) |


Figure 11. Data coverage of the C3S SM v202512 PASSIVE product over land (excl. Antarctica) for the full period (1991-08 to 2024-12).
Expressed as a percentage of the total number of days per period, (a) over the full period, (b) per month.
Compared to the previous version (v202312), data coverage of the PASSIVE product overall increased slightly (Figure 12). This is due to the inclusion of daytime retrievals for the sensors that are also used in the generation of the ICDR product (SMOS, SMAP, GPM, and AMSR2). In v202312 only nighttime data were used for these sensors.
(a) |
(b) |


Figure 12. Change in fractional data coverage of the PASSIVE product between v202312 and v202505.
Root-zone Soil Moisture product
For the RZSM product, the COMBINED values are passed through an infiltration model, which essentially smoothes (in time) and delays the measurements. Therefore, spatial patterns of absolute RZSM (Figure 13) are – as expected – similar to the COMBINED product.
(a) |
|


Figure 13. C3S v202505 Root-zone Soil Moisture 0-1m weighted average layer (full period), average over all days by grid cell (a) and by latitude/month (b).
Spatial and temporal data coverage of the aggregated 0-1 m layer of the new RZSM product is shown in Figure 14. The RZSM product uses values from COMBINED as input for the pre-calibrated infiltration model. Therefore it is expected that the coverage between the two is similar. However, the coverage is slightly higher for the RZSM data than for the COMBINED product. This is because the infiltration model uses data from multiple days. While the uncertainties of values increase when no recent surface measurements are available, root-zone conditions can still be estimated for a limited time, and, consequently, fill the temporal gaps within the product.
|
(b) |


Figure 14. RZSM coverage (based on the provided 0-1 m aggregated depth field).
C3S RZSM is provided for the first time in v202505. Therefore, no comparisons to previous versions are possible.
Comparison of soil moisture fields
Daily images for each of the ACTIVE, PASSIVE, and COMBINED products have been compared for C3S v202505 and v202312 (computing the difference between them). Figure 15 shows that the largest differences are found in the ACTIVE product (Fig. 15a). This is due to the new ASCAT version used (and the scaling of ERS to ASCAT), where dry regions affected by subsurface scattering are masked out. This, however, increases the overall mean soil moisture in these latitudes. In higher latitudes, the newly implemented trend correction and masking with ERA5-Land has led to overall drier values in the new version.
Some changes are found in COMBINED accordingly (Fig. 15b), which is attributed to the coverage changes as well as a reprocessing of GLDAS Noah, which can affect the absolute values in v202505. PASSIVE remained similar to the previous version (Fig. 15c).
(a)
(b)
(c) |


Figure 15. Absolute difference in soil moisture between C3S SM v202505 and v202312 for the daily COMBINED (a), ACTIVE (b) and PASSIVE (c) products.
Time series analysis
Analysis of time series from a small number of locations provides insight into the behavior of the product for different climate and land cover types. Five points have been chosen for which ISMN in situ data are available. Details of the points are provided in Table 4 and they are shown on a global map in Figure 16.
Table 4. Details of locations chosen for time series analysis.
# | Ancillary | C3S data location | ISMN station location | |||||
Climate class | Land cover class | Country | GPI | Lat [°] | Lon [°] | Lat [°] | Lon [°] | |
1 | Dsc | Sparse vegetation | USA | 890047 | 64.625 | -148.125 | 64.7232 | -148.151 |
2 | Cfa | Cropland | Australia | 316669 | -35.125 | 147.375 | -35.1249 | 147.4974 |
3 | BSk | Cropland | Spain | 756697 | 41.375 | -5.625 | 41.2747 | -5.5919 |
4 | Cfb | Grassland | Germany | 810025 | 50.625 | 6.375 | 50.5149 | 6.3756 |
5 | Cfa | Broadleaf forest | USA | 733335 | 37.375 | -86.125 | 37.2504 | -86.2325 |
Note: all are classified as having ‘medium’ soil texture.

Figure 16. Locations of the points used in the time series comparison (points are given at the C3S GPI location).
The time series (temporally aggregated per month) for the individual locations for the ACTIVE, PASSIVE, and COMBINED products are given in Figure 17. In general, the time series appear to follow expected seasonal cycles at each location, i.e. winters are wetter and summers drier and, in the case of Grid point index (GPI) 890047 (which is located in Alaska), there are gaps in the data where the location is covered by snow each winter. For some locations (e.g. GPI 733335) a sudden drop in SM is visible, corresponding to the introduction date of SMOS. However, this is less pronounced in COMBINED and therefore most likely related to the scaling applied in generating the PASSIVE product.

Figure 17. Time series of soil moisture (COMBINED, PASSIVE, RZSM in [m3/m3], ACTIVE in [% sat.]) comparison for the COMBINED, ACTIVE, PASSIVE and RZSM products of C3S v202505 for the GPIs and land cover types stated for each plot (locations in Figure 16).
Version Comparison
(a) | (b) |
(c) | |


Figure 18. Time series of soil moisture for the different land cover classes considered (GPI locations shown in Figure 16). Showing the data for the (a) ACTIVE, (b) PASSIVE, and (c) COMBINED products from v202312 and v202505 aggregated via 10-daily averages.
The locations, for which the observation time series are shown in Figure 18 for the different product versions, are the same as in Figure 17. Overall, the products appear almost unchanged in most locations. For most points, the expected decrease in data coverage is found in ACTIVE.
Comparison of global statistics
To demonstrate the differences between the previous C3S version (v202312) and the current dataset (v202505), global statistics have been computed for each dataset version and are provided in Table 5. These are based on the monthly averaged images and representative of the full dataset period.
As expected, the statistics remained mostly unchanged for COMBINED and PASSIVE. For ACTIVE, larger differences are found, which is due to the new ASCAT data stream used in v202505. The maximum detected for RZSM can, in some outlier cases, exceed the physical threshold of 1 m³/m³, which is unrealistic and should be capped in future versions.
Table 5. Dataset statistics for the C3S SM CDRs for the full period (after 1978 and 1991 for PASSIVE/COMBINED/RZSM and ACTIVE, respectively). The numbers given are the mean values across all points. Computed from the monthly aggregated products.
Metric | COMBINED [m3/m3] | ACTIVE [% sat.] | PASSIVE [m3/m3] | RZSM [m3/m3] | |||
|---|---|---|---|---|---|---|---|
v202312 | v202505 | v202312 | v202505 | v202312 | v202505 | v202505 | |
Mean | 0.21 | 0.20 | 43.68 | 40.97 | 0.23 | 0.23 | 0.20 |
Median | 0.21 | 0.21 | 44.67 | 39.47 | 0.20 | 0.20 | 0.21 |
Std. dev. | 0.09 | 0.08 | 26.61 | 20.10 | 0.14 | 0.14 | 0.08 |
Max | 1 | 1 | 100 | 100 | 1 | 1 | 1.04 |
Min | 0 | 0 | 0 | 0 | 0 | 0 | 0 |
Surface Soil Moisture Accuracy – Comparison against ISMN
The C3S SM COMBINED dataset has been compared to the ISMN dataset and the correlations and ubRMSD between the two datasets were calculated. A mean and standard deviation matching was applied to bring satellite and in situ observations into the same value range.
In addition to the global metrics, results are stratified for different station attributes, which are provided as metadata within the ISMN dataset: (i) sensor depth, (ii) soil texture, and (iii) land cover class. For further information on the origin of these attributes, see Dorigo et al. (2011) .
The focus here is on the COMBINED product as this is the recommended product for most applications and designed to theoretically outperform the ACTIVE and PASSIVE products. All box plots in the following chapters indicate the median, interquartile range, and 1.5*interquartile range of metrics found between the satellite and reference data products.
Validation runs from the following chapters are traceable5. The following validation runs are available on QA4SM and validation results are published on Zenodo (all resources validated 3rd September 2025).
Validation runs for Chapter 2.1.5.1
C3S SM COMBINED v202505 & v202312 vs ISMN Fiducial Reference Measurements (FRMs) (absolute SM) 0-10 cm
published through QA4SM at https://qa4sm.eu/ui/validation-result/5285eac1-6c40-4010-bd2c-54cb5300c6fe •

C3S SM COMBINED v202505 & v202312 vs ISMN FRMs (SM anomalies) 0-10 cm
- published through QA4SM at https://qa4sm.eu/ui/validation-result/bb40d46d-6df1-4e94-8ed3-36a5738cb1b1 •

- published through QA4SM at https://qa4sm.eu/ui/validation-result/bb40d46d-6df1-4e94-8ed3-36a5738cb1b1 •
Validation runs for Chapter 2.1.5.2
C3S SM COMBINED v202012 & v202212 & v202312 & v202505 & ERA5-Land vs ISMN FRMs (absolute) 0-10 cm
Full Period • QA4SM: https://qa4sm.eu/ui/validation-result/7341cfd9-2556-4fb9-86f7-a32fe579d393 •

Period 1996-1999 • QA4SM: https://qa4sm.eu/ui/validation-result/413b776c-599e-4d17-b068-7dd67a20867c •

Period 2000-2003 • QA4SM: https://qa4sm.eu/ui/validation-result/755d3a9d-900f-4c37-86fe-ab36fe220d07 •

Period 2004-2007 • QA4SM: https://qa4sm.eu/ui/validation-result/df856136-990d-4833-8c07-a1c78f9e8073 •

Period 2008-2011 • QA4SM: https://qa4sm.eu/ui/validation-result/38165fdc-1065-4d5e-b5d5-c30e1dd86f63 •

Period 2012-2015 • QA4SM: https://qa4sm.eu/ui/validation-result/6aec4c3d-16fb-4316-b027-a34c00758b2b •

Period 2016-2019 • QA4SM: https://qa4sm.eu/ui/validation-result/745e38d0-a49e-40d1-a93a-18dcca51f332 •

Validation results
The comparison of C3S v202505 has been processed using the QA4SM service against ISMN FRMs at v20250617. The global map in Figure 19 shows the correlation (Pearson's) for each ISMN station to the nearest C3S grid cell; the same is shown for ubRMSD in Figure 20. These figures show the expected spatial patterns, with correlations mostly between 0.6-0.75 and ubRMSD between 0.025-0.04 m3/m3 (as required below the minimum ubRMSD KPI threshold of 0.1 m3/m3). The performance of COMBINED v202505 is slightly above v202312 in this comparison.
(a) | (b) |


Figure 19. Correlation (Pearson's) between C3S v202505 COMBINED and ISMN v20250617 FRMs for sensors in 0–10 cm depth (a), and comparison of global scores with C3S v202312 COMBINED (b). Available via https://qa4sm.eu (resource validated 3rd September 2025).
White boxes contain the computed validation scores for all ISMN sensors (N), coloured boxes indicate the lower and upper limits of the 95% confidence interval (CI) at the same locations.
(a) |
(b) |


Figure 20. ubRMSD between C3S v202505 COMBINED and ISMN v20250617 FRMs for sensors in 0–10 cm depth (a) and comparison with C3S v202312 COMBINED (b). Available via https://qa4sm.eu (resource validated 3rd September 2025).
White boxes contain the computed validation scores for all ISMN sensors (N), coloured boxes indicate the lower and upper limits of the 95% confidence interval (CI) at the same locations.
The same analysis is repeated for soil moisture anomalies from both data sets. Available observations in the period between 1990 and 2020 are averaged and subsequently smoothed with a 30-day moving window to create the climatological reference. Anomaly correlations indicate how well individual precipitation or drought events at the in situ stations are captured by the ~25 km satellite grid cells.
The ubRMSD is generally higher, and the correlation is lower respectively, compared to the absolute values (Figure 22). This is expected, as the well-represented seasonal signal component in both time series is no longer taken into account. However, as for the absolute values, the differences between the two C3S SM versions are negligible.
(a) |
(b) |


Figure 22. Correlation (a) and ubRMSD (b) between anomalies from C3S v202505 and v202312 COMBINED and ISMN v20250617 FRMs for soil depths of 0–10 cm. Available via https://qa4sm.eu (resource validated 3rd September 2025).
White boxes contain the computed validation scores for all ISMN sensors (N), coloured boxes indicate the lower and upper limits of the 95% confidence interval at the same locations.
Stratification - Soil Texture
The correlation coefficients and ubRMSD values between the C3S dataset and the in situ datasets for the different soil textures (fine, medium, and coarse; stratification provided from the ISMN dataset (Dorigo et al. 2011), shown in Figure 23) are presented in Figure 24 and Figure 25, respectively.

Figure 23. Soil texture classification used for the ISMN comparison. The percentage clay, silt, and sand are taken from the ISMN metadata which, in turn, is retrieved from the Harmonised World Soil Database (HWSD).
The product appears to perform best for medium and fine texture soils in terms of correlation and ubRMSD (for both depth layers). The spread in ubRMSD for fine soil textures is higher than for medium textures. Notice that the number of available sensors between soil texture classes changes significantly for different depths. While for most sensors in the top four centimeters "Coarse granularity" is assigned, "Medium granularity" is the predominant class for sensors below four centimeters. Compared to the previous version, correlation coefficients between satellite and in situ data remained mostly unchanged. In most cases, v202505 shows a slightly better agreement with ISMN than v202312.

Figure 24. Pearson's R between absolute values of C3S SM COMBINED and ISMN for different soil texture classifications and depths.

Figure 25. ubRMSD between absolute values of C3S SM COMBINED and ISMN for different soil texture classifications and depths.
The same overall level of agreement is found when comparing anomaly correlations and ubRMSD (Figure 26 and Figure 27). In most cases, v202505 slightly outperforms v202312.

Figure 26. Pearson's R between anomaly values of C3S SM COMBINED and ISMN for different soil texture classifications and depths.

Figure 27. ubRMSD between anomaly values of C3S SM COMBINED and ISMN for different soil texture classifications and depths.
Stratification - Landcover classes
The correlation and ubRMSD between the C3S dataset and the in situ datasets are aggregated for five different land cover classes: (i) "Cropland", (ii) "Grassland", (iii) "Tree Cover", (iv) "Urban Areas", (v) "Other"; stratification based on ESA CCI Landcover (Figure 28). Land cover values at the stations are provided with the ISMN measurements (Dorigo et al. 2011).
 Figure 28. ESA CCI Landcover Classes used to stratify ISMN validation results. Graphic modified from https://maps.elie.ucl.ac.be (resource validated 3rd September 2025)
Stations with land cover class "Grassland" assigned show the highest correlation (and lowest ubRMSD) with the satellite products among classes with a relevant number of stations. Points with "Tree Cover" on the other hand perform worst for both metrics between absolute values (Figure 29 and Figure 30) as well as anomalies (Figure 31 and Figure 32). The new C3S COMBINED product performs slightly better than the previous version in all relevant cases.
The ubRMSD can be taken as a measure of accuracy and the KPIs (Table 6) specifically state the acceptable accuracy level of the product is between 0.01 and 0.10 m3/m3 for different land cover types. Therefore, overall the KPIs are met. The GCOS target of 0.04 is m3/m3 is reached in most cases.

Figure 29. Correlation (Pearson's) between absolute values of C3S SM COMBINED and ISMN for different land cover classes in 0-10 cm depth.

Figure 30. ubRMSD between absolute values of C3S SM COMBINED and ISMN for different land cover classes in 0-10 cm depth.

Figure 31. Correlation (Pearson's) between anomaly values of C3S SM COMBINED and ISMN for different land cover classes in 0-10 cm depth.

Figure 32. ubRMSD between anomaly values of C3S SM COMBINED and ISMN for different land cover classes in 0-10 cm depth.
Comparison to previous versions
A comparison of different versions of the C3S SM product in terms of agreement with in situ data is provided as gobal correlation (Figure 33) and ubRMSD (Figure 34) scores. Absolute soil moisture values are used in this comparison. Only time stamps with valid observations in all data sets in the common period (1981-01 to 2020-12) are used. ERA5-Land temperature is used to consistently remove all observations when the soil temperature is below 0° C. It can be seen that the overall correlation and ubRMSD between the in situ and satellite-derived soil moisture datasets improve with the release of new C3S SM product versions over time.

Figure 33. Correlation between the last four C3S SM versions (latest version on the left), ERA5-Land, and ISMN FRMs.
White boxes contain the computed validation scores for all ISMN sensors (N), coloured boxes indicate the lower and upper limits of the 95% confidence interval at the same locations.

Figure 34. ubRMSD between the last four C3S SM versions (latest version on the left), ERA5-Land, and ISMN FRMs.
White boxes contain the computed validation scores for all ISMN sensors (N), coloured boxes indicate the lower and upper limits of the 95% confidence interval at the same locations.
In addition, ISMN is compared to the latest four C3S SM versions and ERA5-Land (Figure 35), in 6 different sub-periods with a length of 4 years each (i) 1996-1999, (ii) 2000-2003, (iii) 2004-2007, (iv) 2008-2011, (v) 2012-2015, (vi) 2016-2019. An increase in R of all C3S SM versions over time is found. Higher correlations with ISMN are found for v202505 than for previous versions. ERA5-Land shows overall better correspondence with the in situ data than the satellite products, especially in earlier periods. Relative differences between satellite and reanalysis products decrease significantly after 2015. This is likely due to the increased number of observations available as input to the C3S satellite products within this period. Especially the period after 2015 is positively affected by the addition of SMAP and shows higher correlations than the previous periods.

Figure 35. Correlation between ISMN FRMs (0-10 cm) and C3S satellite products and ERA5-Land for different periods.
Surface Soil Moisture Accuracy – Comparison against ERA5-Land reanalysis
C3S COMBINED v202505 has been compared against ERA5-Land top layer Soil Moisture (from 1981-01-01 to 2024-12-31, at 0:00 UTC). Metrics are computed for absolute soil moisture values, as well as anomaly values (reference period 1991-2020). Mean-standard deviation scaling is applied to remove biases between the satellite and reanalysis data prior to validation metrics computation.
Validation runs from this chapter are traceable. The following validation runs are available on QA4SM and published on Zenodo (all resources validated 3rd September 2025):
- Validation runs for Chapter 2.1.6.1.
- C3S SM COMBINED v202505 vs v202312 vs ERA5-Land SWVL1 (absolute)
- published through QA4SM at https://qa4sm.eu/ui/validation-result/37c26194-aed1-44f5-9366-58d36fc3edf6 •

- published through QA4SM at https://qa4sm.eu/ui/validation-result/37c26194-aed1-44f5-9366-58d36fc3edf6 •
- C3S SM COMBINED v202505 vs v202412 vs ERA5-Land SWVL1 (anomalies)
- published through QA4SM at https://qa4sm.eu/ui/validation-result/9a7a5e2a-c191-437e-93f8-bc7efcd9eed3 •

- published through QA4SM at https://qa4sm.eu/ui/validation-result/9a7a5e2a-c191-437e-93f8-bc7efcd9eed3 •
- C3S SM COMBINED v202505 vs v202312 vs ERA5-Land SWVL1 (absolute)
Comparison of absolute values
The absolute values C3S COMBINED v202505 and v202312 are compared against ERA5-Land top layer Soil Moisture. Correlation and ubRMSD are shown in Figure 36 and Figure 37, respectively.
Fig. 36a shows expected spatial patterns in the correlation coefficient (Pearson's) between ERA5-Land and C3S SM v202505. There is a high positive correlation between the products in most temperate zones, with lower correlations being most prevalent in the northern, boreal regions. The deserts show little to no positive correlation. Comparison to the previous C3S SM version indicates a similar level of agreement between the reanalysis and satellite products. The same can be seen in terms of ubRMSD (Figure 37). ubRMSD is low (global median below 0.04 m3/m3), with a significant portion below the 0.1 m3/m3 threshold required in the KPIs.
(a) |
(b) |


Figure 36. Correlation (Pearson's) between absolute soil moisture values of the C3S SM v202505 COMBINED product and ERA5-Land top-level soil water content (a) and global comparison with the previous C3S SM version (b).
White boxes contain the computed validation scores for all ERA5-Land grid cells (N), coloured boxes indicate the lower and upper limits of the 95% confidence interval. Available via https://qa4sm.eu (resource validated 3rd September 2025).
(a) |
(b) |


Figure 37. ubRMSD between absolute soil moisture values of the C3S SM v202505 COMBINED product and ERA5-Land top-level soil water content (a) and global comparison with the previous C3S SM version (b).
White boxes contain the computed validation scores for all ISMN sensors (N), coloured boxes indicate the lower and upper limits of the 95% confidence interval at the same locations. Available via https://qa4sm.eu (resource validated 3rd September 2025).
To compare the results for the current and previous versions spatially (v202505 vs v202312), differences in correlation and ubRMSD are computed. Improvements in correlation and reduction in ubRMSD of absolute values are shown in blue in Figure 38. In general, both versions show a very similar level of agreement with ERA5-Land, with maximum absolute difference rarely above 0.1 (R) and 0.01 m³/m³ (ubRMSD).
|
|


Figure 38. Change in absolute SM values correlations (a) and ubRMSD (b) wrt. ERA5-Land top layer SM, between C3S SM COMBINED v202505 and v202312. Blue areas indicate higher agreement between the new satellite dataset version and reanalysis, red is the opposite.
Stability Monitoring
Validation runs from this chapter are traceable. The following validation runs are available on QA4SM and published on Zenodo (all resources validated 3rd September 2025):
- Validation runs for Chapter 2.1.7.1.
- C3S SM v202505 COMBINED vs ISMN (0-10cm) - Annual Stability - absolute
- published through QA4SM at https://qa4sm.eu/ui/validation-result/e5447b65-d012-4a3f-a366-518e20e70262 •

- published through QA4SM at https://qa4sm.eu/ui/validation-result/e5447b65-d012-4a3f-a366-518e20e70262 •
- C3S SM v202505 RZSM (0-1 m) vs ISMN (0-1 m) - Annual Stability - absolute
- published through QA4SM at https://qa4sm.eu/ui/validation-result/d850c880-6d3a-4289-8e23-3875b842cfcc •

- published through QA4SM at https://qa4sm.eu/ui/validation-result/d850c880-6d3a-4289-8e23-3875b842cfcc •
- C3S SM v202505 COMBINED vs ISMN (0-10cm) - Annual Stability - absolute
About Stability Metrics
The development of methods for monitoring the stability of (multi)satellite soil moisture records is still subject of reserach. Preliminary results are presented. Methods might change in future.
Surface Soil Moisture
To assess the accuracy evolution of the C3S SM dataset quality over time, a preliminary analysis is performed of the evolution of accuracy over the 1978 to 2024 period, using ISMN as reference measurements. In this case not only FRMs are used, but all available ISMN sensors between 0 and 5 cm depth. A bias correction is applied by scaling the satellite data to the in situ observations via mean and standard deviation matching.
Figure 39 shows the evolution of ubRMSD for different land cover types (described in Chapter 2.1.5.1.2). It shows that the stability of C3S SM (COMBINED) varies, depending on the land cover type. Similar patterns are found when results are stratified for different climate classes (not shown). An important factor to consider in this comparison is the number of ISMN stations available each year (number below the boxes). The low number of available in situ stations and their uneven global distribution should be considered. Notably, there are more ISMN stations available over time.
The product appears to be most stable for "Grasslands" and "Croplands", while for other landcover classes, there is visible variation in the product, especially in earlier periods. Here, note the expected widespread error for the "Urban areas" land cover. This is probably caused by the spatial resolution of C3S SM, where soil moisture networks close to densely populated areas are less representative of the whole C3S SM cell as satellite SM in these areas can be affected by landcover changes (urbanization) and RFI.
The stability is assessed as the slope (per decade) of a linear fit through the annual median ubRMSD values at ISMN stations with at least 10 years of ubRMSD estimates. The mean of the ubRMSD slopes is negative, as shown in the histogram plots in Figure 39. This indicates that the accuracy of the product improves over time. While we consider this as benefitial for most applications, for a stable product performance a trend in either direction (positive or negative) is undisreable as it indicates a systematic accuracy change in the product.
The temporal stability of the COMBINED product of C3S SM fulfills the GCOS breakthrough value (ubRMSD slope) of 0.01 m3m-3/decade in 63% of cases, and the GCOS threshold of 0.02 m3m-3/decade in 87% of cases.
Annual ubRMSD estimates | Inter-annual stability estimates (ubRMSD slope) |
|
|


Figure 39. Accuracy evolution of C3S v202505 COMBINED between 2000 and 2024 in terms of annual ubRMSD (left). The numbers at the bottom indicate the number of ISMN stations used in the comparison. Distribution of Theil-Sen slope estimate (GCOS margins indicated as vertical lines) through annual ubRMSD values for all tested locations (right); Aggregated land cover classes: (a) Cropland (b) Grassland (c) Tree Cover (d) Urban Areas.
Root-zone Soil Moisture Stability
Root zone soil moisture shows a similar picture as the surface product in the previous chapter in terms of temporal stability (Figure 40). Overall the product seems to be slightly more stable, especially in forested areas. In terms of ubRMSD slopes, the stability assessment can rely on more in situ measurements compared to the surface product, as the root-zone layer is wider than the surface layer (1 m vs 10 cm).
The root-zone product of C3S SM is below the stability GCOS breakthrough value (ubRMSD slope) of 0.01 m3m-3/decade in 63% of cases, and below the GCOS threshold of 0.02 m3m-3/decade in 86% of cases, which is consistent with results for the surface layer.
Annual ubRMSD estimates | Inter-annual stability estimates (ubRMSD slope) |
|
|


Figure 40. Accuracy evolution of C3S v202505 RZSM (0-1 m) between 2000 and 2024 in terms of annual ubRMSD (left). The numbers at the bottom indicate the number of ISMN stations used in the comparison. Distribution of Theil-Sen slope estimate through annual ubRMSD values for all tested locations (right). Aggregated land cover classes: (a) Cropland (b) Grassland (c) Tree Cover (d) Urban Areas.
Uncertainty analysis
The algorithm used to develop the C3S soil moisture product utilizes triple collocation analysis to estimate signal-to-noise ratios (SNR) for the combination of different soil moisture observations (Gruber et al. 2017). Based on SNR estimates, weights are assigned to each sensor for merging. Uncertainties are computed on a day-of-year (DOY) basis, meaning that different levels of intra-annual (seasonal) uncertainties are used to weight and subsequently merge sensors (Stradiotti et al., 2025).
Figure 41 shows time-latitude diagrams of all sensors merged in the v202505 COMBINED product. Compared to the previous version, daytime measurements for AMSR2 (asc.), GPM (asc.), SMAP (asc.) and SMOS (desc.) are now also used for the merged product.

Figure 41. Intra-annual Signal-to-Noise Ratio estimates (gapfilled) derived from Triple Collocation Analysis for all sensors (day- and night-time / ascending and descending overpass) merged in C3S SM.
In combination with error propagation techniques, a per-pixel uncertainty is provided within the C3S SM product in the "sm_uncertainty" field (Figure 42). It is expected that the overall levels of uncertainty associated with the product reduce over time as additional, more accurate sensors become available (compare also Chapter 2.1.1). A higher level of agreement generally is found between sensors in the later periods. Throughout the product period, the uncertainties are always higher at latitudes with dense vegetation cover, for example at 10 degrees south. This is expected as it is more difficult to retrieve soil moisture in these areas (compare Figure 41), leading to a higher random error variance. Since the introduction of intra-annual error estimates (Stradiotti et al., 2025), seasonal variations in the uncertainty field are expected.

Figure 42. Monthly averages of the uncertainty variable associated with the C3S SM v202505 COMBINED product per latitude over time.
Evaluation of the ACTIVE and PASSIVE products
Validation runs from the following chapters are traceable. The following validation runs are available on QA4SM and validation results are published on Zenodo. (All resources validated 3rd September 2025)
- Validation runs for Chapter 2.1.9.1
C3S SM ACTIVE/PASSIVE/COMBINED vs ISMN FRMs 0-10 cm (absolute)
published through QA4SM at https://qa4sm.eu/ui/validation-result/33e5467e-351e-44c5-96ed-8e55ff60043c •

- Validation runs for Chapter 2.1.9.2
C3S SM ACTIVE/PASSIVE/COMBINED vs ERA5-LAND swvl1 (absolute)
published through QA4SM at https://qa4sm.eu/ui/validation-result/ec0e1c22-cd31-4fa9-9e53-3216deaff920 •

Comparison to ISMN FRMs
To demonstrate the differences between the ACTIVE, PASSIVE and COMBINED products, results of the comparison against ISMN (FRM) data is shown in Figure 43. COMBINED is used as the reference for mean/standard deviation scaling. Only common observation time stamps between the ACTIVE, PASSIVE, COMBINED products are used in the comparison, which is why metrics for COMBINED deviate slightly from the ones presented in Chapter 2.1.5.
The COMBINED product is designed to outperforms the individual ACTIVE and PASSIVE products, which is confirmed here. PASSIVE agrees slightly better with ISMN than ACTIVE in this comparison.
|
|


Figure 43. Comparison of C3S SM v202505 COMBINED, ACTIVE, PASSIVE against ISMN FRMs (0-10 cm) in terms of R (a) and ubRMSD (b).
Comparison to ERA5-Land
The ACTIVE and PASSIVE products of C3S SM v202312 were also compared to the ERA5-Land reanalysis (Figure 44). The agreement between the reanalysis data and the COMBINED product is higher than for the individual PASSIVE or ACTIVE products.
(a) |
(b) |


Figure 44. Intercomparison of the COMBINED, ACTIVE, PASSIVE product of C3S v202505, with ERA5-Land as the reference – plots shown are for Pearson's R (a) and ubRMSD (b). Only common locations and timestamps between all inter-compared products are considered.
Figure 45 and Figure 46 show differences in correlation and ubRMSD with respect to ERA5-LAND, respectively, between the COMBINED and ACTIVE, and COMBINED and PASSIVE products. The COMBINED product usually outperforms the ACTIVE and PASSIVE products. The ACTIVE product still performs well in (sub)tropical and temperate climates (with vegetation cover), while passive data is preferred in arid regions.
|
|


Figure 45. Difference in correlation with ERA5-LAND between the COMBINED and ACTIVE (a), resp. COMBINED and PASSIVE (b) products of C3S SM v202505.
(a) |
(b) |


Figure 46. Difference in ubRMSD with ERA5-LAND between the COMBINED and ACTIVE (a), resp. COMBINED and PASSIVE (b) products of C3S SM v202505.
Differences in long-term SM trends between the three products
Long-term trends in SM data sets are key to understanding the impact of climate change on global soil moisture. With more than 40 years of data, long-term trends can be computed from C3S SM. The COMBINED product has been used for analyses like this before (Dorigo et al. 2012). Ideally, one would expect similar trends in the ACTIVE, COMBINED, and PASSIVE products. However, as Figure 47 shows, there are differences in trends for the COMBINED, ACTIVE and PASSIVE products (slops based on annual average values for the period 1992-2023).
(a) | |
(b) |
(c) |


Figure 47. Long-term trends (Theil-Sen annual median slope) from 1992-2023 in C3S SM v202312 COMBINED (a), ACTIVE (b), and PASSIVE (c). A Mann-Kendall significance test was applied and only locations with statistically significant (p<0.05) trends are shown.
Evaluation of root-zone layers
Validation runs from the following chapters are traceable. The following validation runs are available on QA4SM and validation results are published on Zenodo. (All resources validated 3rd September 2025)
- Validation runs for Chapter 2.1.10.1
- C3S RZSM (0-1 m layer) vs ISMN (0-1 m) - absolute values
- published through QA4SM at https://qa4sm.eu/ui/validation-result/1d5c2a08-0945-44fe-89c5-67987a08e30c •

- published through QA4SM at https://qa4sm.eu/ui/validation-result/1d5c2a08-0945-44fe-89c5-67987a08e30c •
- C3S RZSM (0-1 m layer) vs ISMN (0-1 m) - absolute values
- Validation runs for Chapter 2.1.10.2
C3S RZSM Layer 1 (0-10 cm) vs. ERA5-Land (swvl1) - absolute values
published through QA4SM at https://qa4sm.eu/ui/validation-result/b34a4151-62d7-40f4-b8fd-453a44c0a3ce •

C3S RZSM Layer 2 (10-40 cm) vs. ERA5-Land (swvl2) - absolute values
published through QA4SM at https://qa4sm.eu/ui/validation-result/678f2235-662d-4a30-9ac3-8d3be70c130b •

C3S RZSM Layer 3 (40-100 cm) vs. ERA5-Land (swvl3) - absolute values
published through QA4SM at https://qa4sm.eu/ui/validation-result/036455a6-27a8-4cc6-bad3-6f4159469cb5 •

Comparison against in situ measurements
ISMN measurements are used to calibrate the infiltration model used in C3S SM for three depth layers (Pasik et al., 2023). Therefore we only compare the aggregated (averaged 0-1 m) layer of C3S RZSM to in situ measurements from the ISMN. Figure 48 shows the agreement with all ISMN measurements in 0-1 m depth in terms of Pearson's R, and Figure 49 for ubRMSD. The median correlation is 0.55 with more than 11000 reference time series, the median ubRMSD is ~0.012 m³/m³. The correlation is slightly lower than for the C3S surface soil moisture products. However, this is expected as the 0-1 m layer, that was evaluated here, is driven by the values from the 40-100 cm depth layer. Accordingly, Pasik et al. (2023) have reported in their study on the design of the method, that the quality of the predictions is expected to decrease slightly with greater depth, due to the weaker coupling of surface and root-zone layers.
However, at the same time, the ubRMSD performs better than for the COMBINED surface SM product. This is because of more stable temporal soil moisture signals in greater depths. ubRMSD is below the 0.04 m³/m³ GCOS threshold for 95% of 11330 time series in total, for which ubRMSD could be computed (i.e., excluding points with missing values from Figure 49).
(a) |
(b) |


Figure 48. Correlation (Pearson's) between C3S v202505 RZSM (0-1m) and ISMN v20250617 (all sensors) in 0–1 m depth. The spatial distribution is shown in (a), box plots with the upper and lower 95 % confidence interval limits are shown in (b). White boxes contain the computed validation scores for all ISMN sensors (N), coloured boxes indicate the lower and upper limits of the 95% confidence interval (CI) at the same locations. Available via https://qa4sm.eu. (resource validated 3rd September 2025)
(a) |
(b) |


Figure 49. ubRMSD between C3S v202505 RZSM (0-1m) and ISMN v20250617 (all sensors) in 0-1 m depth. The spatial distribution is shown in (a), box plots with the upper and lower 95 % confidence interval limits are shown in (b). White boxes contain the computed validation scores for all ISMN sensors (N), coloured boxes indicate the lower and upper limits of the 95% confidence interval (CI) at the same locations.
Available via https://qa4sm.eu. (resource validated 3rd September 2025)
RZSM Layer comparison against ERA5-Land
Data from the three individual C3S RZSM layers (0–10 cm, 10–40 cm, 40–100 cm) were compared with root-zone soil moisture from the corresponding layer of ERA5-Land (0–7 cm, 7–28 cm, 28–100 cm) in Figure 50. As ISMN data were used to calibrate the infiltration model for C3S RZSM, no in situ data are included in this assessment.
In line with Pasik et al. (2023) we find good agreement between the C3S RZSM and reanalysis data in most regions globally. Differences occur mainly at high latitudes, where missing values increase due to frozen soils, and in desert regions. In these cases, the soil moisture signal in the satellite products is weak and largely dominated by noise. Therefore – similar to the surface soil moisture products – it is recommended to exercise caution when using the data in these regions.
(a) |
(b) | ||
(c) |
|


Figure 50. Agreement between C3S RZSM and the according layer data of ERA5-Land. Maps show Pearson's R values for the 0-10 cm (a), 10-40 cm (b), and 40-100 cm (c) layer. The last panel includes boxplots of global R (d) and ubRMSD (e) scores.
Freeze/Thaw Validation Results
Validation with ISMN
Site metrics
We first present the validation metrics for each site where a comparison could be made between ISMN and the F/T dataset. Overall, the time series available for validation are relatively long, in some cases extending up to 8,000 days (Figure 52).
Figure 53 shows the number of frozen days in both the ISMN and the C3S F/T time series over their overlapping periods. The histogram highlights that the F/T dataset generally reports more frozen days than ISMN. Sites with the highest number of frozen days are mainly located in northwestern North America (Figure 53d). This regional pattern is also reflected in the performance metrics. Sites in northwestern North America tend to show lower accuracy (Figure 54) and higher False Discovery Rates (Figure 55). On a global scale, many locations exhibit a relatively high False Discovery Rate, whereas very few sites were misclassified as thawed when they were in fact frozen (Figure 56). This suggests that the current F/T dataset may be prone to over-flagging frozen conditions.
(a) | |
(b) |


Figure 52. Number of days available for comparison at each site, shown as (a) a map and (b) a histogram with accompanying boxplot. Values are given as n_data (days).
(a) | |
(b) | |
(c) | |
(d) |


Figure 53. Number of frozen days for each site during periods where ISMN and F/T time series overlap. Results are shown as (a) ISMN: map, (b) ISMN: histogram with accompanying boxplot, (c) C3S F/T: map, and (d) C3S F/T: histogram with accompanying boxplot.
(a) | |
(b) |


Figure 54. Accuracy (ACC), the proportion of correct freeze/thaw classifications compared with ISMN, shown as (a) a map and (b) a histogram with accompanying boxplot. Higher ACC values indicate better overall agreement.
(a) | |
(b) |


Figure 55. False Discovery Rate (FDR), the proportion of points incorrectly classified as frozen among all points classified as frozen when compared with ISMN, shown as (a) a map and (b) a histogram with accompanying boxplot. Lower FDR values indicate fewer false positives.
(a) | |
(b) |


Figure 56. False Omission Rate (FOR), the proportion of points incorrectly classified as thawed among all points classified as thawed, shown as (a) a map and (b) a histogram with accompanying boxplot. Lower FOR values indicate fewer false negatives.
Global metrics
Here we provide an overview of the site metrics across all locations.
The F/T dataset correctly classified 75% of all predictions. A relatively high False Discovery Rate (FDR) of 66% indicates that a substantial proportion of the cases flagged as frozen were incorrect, reflecting over-flagging. In contrast, the False Omission Rate (FOR) is very low (2%), meaning that almost none of the cases flagged as thawed were actually frozen (Figure 57). The global confusion matrix in Figure 58 provides the exact counts.

Figure 57. Global classification metrics, Accuracy (ACC), False Discovery Rate (FDR), and False Omission Rate (FOR). Higher ACC and lower FDR/FOR values indicate better classification performance.

Figure 58. Global confusion matrix showing the classification of frozen and thawed (Not Frozen) states.
Validation with ERA5-Land
Site Metrics
In this analysis, a “site” corresponds to overlapping grid cells rather than point measurements. Figure 59 shows the amount of data available for comparison in each cell. Cells with lower data availability correspond to areas masked out in the C3S data due to dense vegetation (around the equator) or persistent snow cover (e.g., Greenland).
When comparing the number of frozen days, the C3S F/T dataset shows a pattern more similar to ERA5-Land than to ISMN. However, F/T dataset generally classifies slightly more frozen days than either reference (Figure 60). The spatial distribution of frozen days is consistent with expectations: more frozen days occur at high latitudes in the Northern Hemisphere and at higher altitudes, such as the Himalayas in Asia and the Andes in South America. Notably, the F/T dataset also shows elevated frozen-day counts extending further south than ERA5-Land, including areas such as deserts in North Africa.
High accuracy values (Figure 61) indicate that the F/T dataset generally agrees well with ERA5-Land in classifying frozen and thawed states.
The FDR (Figure 62) reveals an interesting pattern. FDR is very low in regions where frozen soils are expected (northern latitudes), indicating few false positives there. However, large portions of the globe show an FDR of 1. This occurs because the F/T dataset classifies some days as frozen in locations where ERA5-Land reports zero frozen days, which drives the FDR to its maximum. A related pattern can be observed in the FOR (Figure 63). Greenland and other Arctic regions show FOR values of 1, meaning that some frozen days present in ERA5-Land are missed by F/T, leading to false negatives in these regions.
(a) | |
(b) |


Figure 59. Number of days available for comparison at each site, shown as (a) a map and (b) a histogram with accompanying boxplot. Values are given as n_data (days).
(a) | |
(b) | |
(c) | |
(d) |


Figure 60. Number of frozen days for each site during periods where ERA5-Land and F/T time series overlap. Results are shown as (a) ERA5-Land: map, (b) ERA5-Land: histogram with accompanying boxplot, (c) C3S F/T: map, and (d) C3S F/T: histogram with accompanying boxplot.
(a) | |
(b) |


Figure 61. Accuracy (ACC), the proportion of correct freeze/thaw classifications compared with ERA5-Land, shown as (a) a map and (b) a histogram with accompanying boxplot. Higher ACC values indicate better overall agreement.
 (a) | |
(b) |

Figure 62. False Discovery Rate (FDR), the proportion of points incorrectly classified as frozen among all points classified as frozen when compared with ERA5-Land, shown as (a) a map and (b) a histogram with accompanying boxplot. Lower FDR values indicate fewer false positives.
(a) | |
(b) |


Figure 63. False Omission Rate (FOR), the proportion of points incorrectly classified as thawed among all points classified as thawed, shown as (a) a map and (b) a histogram with accompanying boxplot. Lower FOR values indicate fewer false negatives.
Global Metrics
Here we provide an overview of the classification metrics across all locations.
When compared with ERA5-Land, the F/T dataset correctly classified 92% of all predictions. The False Discovery Rate (FDR) is 17%, meaning that some cases classified as frozen were actually incorrect, indicating a tendency toward over-flagging frozen conditions. The False Omission Rate (FOR) is very low (3%), showing that only a small fraction of cases classified as thawed were in fact frozen (Figure 64). The global confusion matrix (Figure 65) provides the exact counts underlying these metrics.
Compared with the ISMN-based validation, the agreement with ERA5-Land is much higher. This is partly because the ERA5-Land comparison covers a much larger spatial domain, including regions such as Africa where frozen conditions are rare and therefore easier to classify correctly. In contrast, most ISMN sensors are located in North America and Europe—regions that also showed lower accuracies in the ERA5-Land comparison (Figure 61a).
Although the overall results are stronger against ERA5-Land, signs of over-flagging frozen soils remain evident in this validation as well. This over-flagging is likely related to the current use of a single-sensor threshold. Implementing a majority-vote approach across sensors could help reduce these false positives and improve robustness.

Figure 64. Global classification metrics, Accuracy (ACC), False Discovery Rate (FDR), and False Omission Rate (FOR). Higher ACC and lower FDR/FOR values indicate better classification performance.

Figure 65. Global confusion matrix showing the classification of frozen and thawed (Not Frozen) states.
Climate Change Assessment
European State of the Climate Report
The C3S SM PASSIVE data are used in the "European State of the Climate 2024"6 report produced by ECMWF. In the report, the C3S SM v202312 PASSIVE SM anomaly data are compared against ERA5-Land SM anomalies (Figure 66). The anomalies from both data sets match well. Key events such as the drought in Eastern Europe in summer and autumn of 2024 are captured by both data sets. Satellite retrievals during winter are usually missing or have a higher level of uncertainty due to frozen soil moisture.
(a) |
(b) |


Figure 66. Monthly soil moisture anomalies for the year 2024 in ERA5-Land (a) and C3S v202312 PASSIVE (b). From the "Soil Moisture" monitoring chapter in "European State of the Climate in 2024"6.
6 The Soil Moisture chapter is available at https://climate.copernicus.eu/esotc/2024/soil-moisture (resource validated 3rd September 2025)
Application(s) specific assessments
Here we provide a brief overview of recent applications using the C3S Soil Moisture product. Soil moisture data are required for a wide range of applications. This list is not intended to be exhaustive.
Satellite soil moisture for (agricultural) drought assessment
Satellite-derived soil moisture provides valuable information for drought assessment, as it directly reflects the amount of water available in the soil for vegetation and ecosystems. Unlike precipitation data alone, soil moisture observations capture the integrated effects of rainfall, evaporation, and land surface conditions, offering a more complete picture of agricultural and hydrological droughts. The consistent, large-scale coverage and long-term records provided by satellite missions enable early detection of drought onset, monitoring of its spatial extent, and evaluation of its impacts over time.
An example study by Vreugdenhil et al. (2022) not only provides a concise overview of various drought indices based on satellite soil moisture observations, but also showcases with an example drought event in Senegal 2014, how the (agricultural) drought conditions in precipitation, soil moisture, and vegetation indices are interconnected and how they can be classified in terms of severity, onset, and duration. Typically, agricultural droughts progress temporally, starting from a precipitation deficit which leads to below average surface and subsequently root-zone soil moisture conditions, which lead to a delayed reduced plant water content and health (Figure 67).
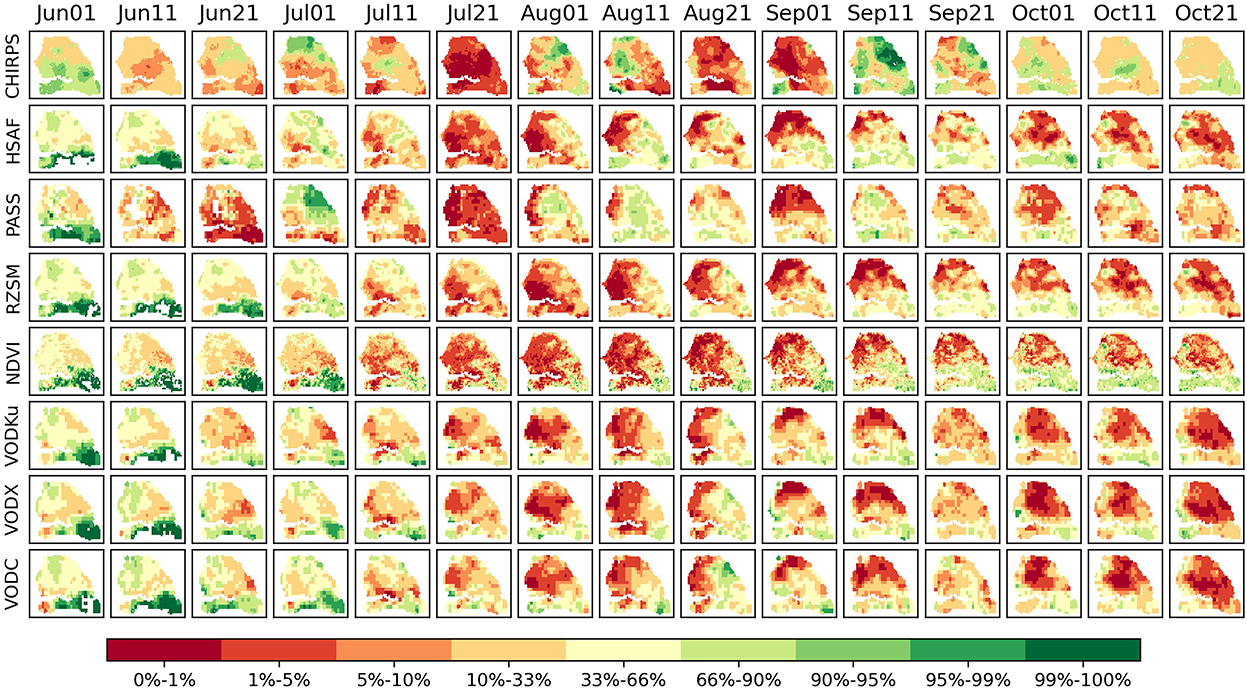
Figure 67 - Spatio-temporal development of the 2014 drought in Senegal represented by anomaly percentiles in soil moisture (H SAF ASCAT SSM, C3S PASSIVE and RZSM), precipitation (Chirps) and vegetation (Normalized Difference Vegetation Index (NDVI) and VOD for frequency bands C, X and Ku).
Figure taken from Vreugdenhil et al. (2022).
Satellite soil moisture for agricultural yield prediction
In line with the study from Section 4.1, Büechi et al. (2022) have used satellite soil moisture and other datasets (vegetation parameters, precipitation, temperature) in a machine learning framework to predict the agricultural yield for a selection of crop types in the Pannonian basin (covering all of Hungary and parts of Slovakia, Czechia, Austria and Romania). They show that a deficit in soil moisture, among other indices, can be used as a predictor for crop yield up to three months before harvest. In this study, CCI Soil Moisture v7, which is the same algorithm as in C3S v202012, was successfully used. It was found that especially data for the root-zone layer (in this case a soil water index (SWI) was used) under drought conditions contains relevant information for prediction (Figure 68).


Figure 68 - (a): Measured (bars) and predicted (lines) maize yield anomalies over the entire Pannonian Basin. The color of the line indicates the lead time (LT) in months before harvest at which the forecast was calculated.
(b): Feature importance for the crop yield predictions under normal and drought conditions. Purple bars indicate the impact of soil moisture.
Figure modified from Büechi et al. (2022).
Improved regional assessment of RZSM from C3S
A recent study by Song et al. (2025) assessed the quality of the C3S Surface Soil Moisture (SSM) and Root-Zone Soil Moisture (RZSM) datasets over the Tibetan Plateau. The authors integrated a machine learning–based (random forest) local infiltration parameter tuning specific to their study area, in contrast to the globally uniform optimal parameter currently applied in the C3S RZSM product. They found that the optimal T-parameter used to predict RZSM from SSM varies regionally (Figure 69). The study suggests that regional tuning of the model used in C3S, adapted to different land-cover and climate conditions, could improve the accuracy of RZSM estimates in other regions as well. This is particularly important for enhancing estimation quality at greater depths, where the coupling between surface and root-zone moisture weakens and the spatial heterogeneity of the optimal T-parameter increases (Figure 69, bottom). Currently, the C3S RZSM product shows lower performance at deeper layers than in the topsoil (Figure 50).

Figure 69 - Spatial distrubution of T parameter predicted by the random forest machine learning model for soil depth of 10 cm, 20 cm, and 40 cm for the Tibetan Plateu study area.
Figure taken from Song et al. (2025).
Compliance with user requirements concerning data quality
The requirements for the C3S soil moisture product were agreed as a set of KPIs defined from consideration of user and GCOS requirements. These KPIs are shown in Table 6. Apart from these KPIs, the (quantitative) accuracy and stability requirements that are directly related to goals set for satellite soil moisture products by GCOS, CMUG and C3S can be found in the PUGS (Preimesberger et al., 2025a), Section 1.7.
Table 6. Key Performance Indicators (KPIs) for the C3S Soil Moisture Product
KPI # | KPI Title | Performance Target and Unit of Measure | Reported value |
|---|---|---|---|
KPI.SM.D1 | Self-assessment of the operational system’s maturity | Target: Full Operational Capacity, measured by Maturity Matrix | Full operational capacity according to the Bates Maturity Matrix self assessment |
KPI.SM.D2 | System Quality Assessment & Reliability | Percentage fixed within one week (guideline 100%) | Achieved |
KPI.SM.D3.1 | Uncertainty: CDR Combined with a daily resolution in latest quarter | Variable (0.01-0.10 m³ / m³), depending on land cover and climate | Below 0.10 m3/m3 for all the different conditions analyzed |
KPI.SM.D3.2 | Stability: CDR Combined with a daily resolution in latest quarter | 0.01 m³/m³/decade | 0.01 m³/m³/decade met for majority of test cases |
KPI.FT.D1 | Self-assessment of the operational system’s maturity | Target: Full Operational Capacity, measured by Maturity Matrix | Initial operational capacity according to the Bates Maturity Matrix self assessment |
KPI.FT.D2 | System Quality Assessment & Reliability | Percentage fixed within one week (guideline 100%) | N/A as the system was newly implemented |
KPI.FT.D3.1 | Uncertainty: CDR Combined with a daily resolution in latest quarter | >90 % classification accuracy | Met for comparison with ERA5-Land but not for comparison with ISMN |
KPI.RZSM.D1 | Self-assessment of the operational system’s maturity | Target: Full Operational Capacity, measured by Maturity Matrix | Initial operational capacity according to the Bates Maturity Matrix self assessment |
KPI.RZSM.D2 | System Quality Assessment & Reliability | Percentage fixed within one week (guideline 100%) | N/A as the system was newly implemented |
KPI.RZSM.D3.1 | Uncertainty: CDR Combined with a daily resolution in latest quarter | Variable (0.01-0.10 m³ / m³), depending on land cover and climate | below 0.10 m3/m3 for all the different conditions analyzed |
KPI.RZSM.D3.2 | Stability: CDR Combined with a daily resolution in latest quarter | 0.005-0.02 m³/m³/decade | 0.01 m³/m³/decade met for majority of test cases |
The Surface Soil Moisture service has reached operational capacity with version v201812.
For the quantitative assessment of the accuracy and stability KPIs, all C3S Satellite Soil Moisture products were evaluated against available reference data in the previous chapters. The ubRMSD, which can be directly taken as a measure of accuracy, is demonstrated to be below 0.10 m3/m3 for all the different conditions analyzed, including land cover type (currently cropland, grassland, and tree cover are considered). Therefore, we consider the accuracy KPI threshold for both the C3S surface and root-zone soil moisture products to be met globally.
The same applies to the stability assessment performed for the C3S SSM and RZSM products against (long-term) in situ reference measurements for stations after the year 2000. We found that the KPI thresholds (0.01 m³/m³/decade) were met for the majority (63% and 84%) of test cases for SSM and RZSM, respectively. More methods to assess SM stability are currently under investigation and will be presented in future evaluation studies.
The classification accuracy of the Freeze/Thaw product was found to be 92% when comparing the data against global ERA5-Land soil temperature, but was 75% (and hence below the 90% KPI target) for the comparison against in situ measurements. This discrepancy is explained by the bias of in situ measurements towards regions affected by seasonal freeze/thaw dynamics (Europe and North America).
It is important to consider that there is a (spatial) bias in the ISMN in situ reference measurements towards some countries in the Northern Hemisphere (North America, Europe, E-Asia), which may also bias the accuracy estimates towards these regions (Dorigo et al., 2021).
References
Bueechi, E., Fischer, M., Crocetti, L., Trnka, M., Grlj, A., Zappa, L. & Dorigo, W. (2023) Crop yield anomaly forecasting in the Pannonian Basin using gradient boosting and its performance in years of severe drought. Agricultural and Forest Meteorology, 340, 109596. Available at: https://doi.org/10.1016/j.agrformet.2023.109596 (resource validated 23rd October 2025).
Dorigo, W., de Jeu, R., Chung, D., Parinussa, R., Liu, Y., Wagner, W., & Fernández-Prieto, D. 2012. Evaluating global trends (1988–2010) in harmonized multi-satellite surface soil moisture, 39
Dorigo, W., Himmelbauer, I., Aberer, D., Schremmer, L., Petrakovic, I., Zappa, L., Preimesberger, W., Xaver, A., Annor, F., Ardö, J., Baldocchi, D., Bitelli, M., Blöschl, G., Bogena, H., Brocca, L., Calvet, J.C., Camarero, J.J., Capello, G., Choi, M., Cosh, M.C., van de Giesen, N., Hajdu, I., Ikonen, J., Jensen, K.H., Kanniah, K.D., de Kat, I., Kirchengast, G., Kumar Rai, P., Kyrouac, J., Larson, K., Liu, S., Loew, A., Moghaddam, M., Martínez Fernández, J., Mattar Bader, C., Morbidelli, R., Musial, J.P., Osenga, E., Palecki, M.A., Pellarin, T., Petropoulos, G.P., Pfeil, I., Powers, J., Robock, A., Rüdiger, C., Rummel, U., Strobel, M., Su, Z., Sullivan, R., Tagesson, T., Varlagin, A., Vreugdenhil, M., Walker, J., Wen, J., Wenger, F., Wigneron, J.P., Woods, M., Yang, K., Zeng, Y., Zhang, X., Zreda, M., Dietrich, S., Gruber, A., van Oevelen, P., Wagner, W., Scipal, K., Drusch, M., & Sabia, R. (2021). The International Soil Moisture Network: serving Earth system science for over a decade. Hydrol. Earth Syst. Sci., 25, 5749-5804
Dorigo, W., Van Oevelen, P., Wagner, W., Drusch, M., Mecklenburg, S., Robock, A., & Jackson, T. 2011. A new international network for in situ soil moisture data. Eos, 92, 141-142
Dorigo, W., Wagner, W., Albergel, C., Albrecht, F., Balsamo, G., Brocca, L., Chung, D., Ertl, M., Forkel, M., Gruber, A., Haas, E., Hamer, P.D., Hirschi, M., Ikonen, J., de Jeu, R., Kidd, R., Lahoz, W., Liu, Y.Y., Miralles, D., Mistelbauer, T., Nicolai-Shaw, N., Parinussa, R., Pratola, C., Reimer, C., van der Schalie, R., Seneviratne, S.I., Smolander, T., & Lecomte, P. 2017. ESA CCI Soil Moisture for improved Earth system understanding: State-of-the art and future directions. Remote Sensing of Environment
Dorigo, W.A., Xaver, A., Vreugdenhil, M., Gruber, A., Hegyiová, A., Sanchis-Dufau, A.D., Zamojski, D., Cordes, C., Wagner, W., & Drusch, M. 2013. Global Automated Quality Control of In Situ Soil Moisture Data from the International Soil Moisture Network. Vadose Zone Journal, 12, 0
Entekhabi, D., Reichle, R. H., Koster, R. D. & Crow, W. T. 2010. Performance Metrics for Soil Moisture Retrievals and Application Requirements. Journal of Hydrometeorology, 11, 832-840.
Fligner, M. A., & Killeen, T. J. 1976. Distribution-Free Two-Sample Tests for Scale. Journal of the American Statistical Association, 71(353), 210–213. https://doi.org/10.1080/01621459.1976.10481517 (resource validated 3rd September 2025)
GCOS (Global Climate Observing System), 2016, THE GLOBAL OBSERVING SYSTEM FOR CLIMATE: IMPLEMENTATION NEEDS, GCOS-200, Available at: https://library.wmo.int/idurl/4/55469 (resource validated 3rd September 2025)
GCOS (Global Climate Observing System), 2022, The 2022 GCOS ECVs Requirements, GCOS-245, Available at: https://library.wmo.int/idurl/4/58111 (resource validated 3rd September 2025)
Gruber, A., Dorigo, W.A., Crow, W., Wagner, W., & Member, S. 2017. Triple Collocation-Based Merging of Satellite Soil Moisture Retrievals, 1-13
Gruber, A., Dorigo, W.A., Zwieback, S., Xaver, A., & Wagn, W. 2013. Characterizing Coarse-Scale Representativeness of in situ Soil Moisture Measurements from the International Soil Moisture Network. Vadose Zone Journal, 12
Gruber, A., Scanlon, T., van der Schalie, R., Wagner, W., and Dorigo, W. 2019. Evolution of the ESA CCI Soil Moisture climate data records and their underlying merging methodology, Earth Syst. Sci. Data, 11, 717–739, https://doi.org/10.5194/essd-11-717-2019 (resource validated 3rd September 2025)
Gruber, A., De Lannoy, G., Albergel, C., Al-Yaari, A., Brocca, L., Calvet, J. C., Colliander, A., Cosh, M., Crow, W., Dorigo, W., Draper, C., Hirschi, M., Kerr, Y., Konings, A., Lahoz, W., Mccoll, K., Montzka, C., Muñoz-Sabater, J., Peng, J., Reichle, R., Richaume, P., Rüdiger, C., Scanlon, T., Van Der Schalie, R., Wingeron, J. P. & Wagner, W. 2020. Validation practices for satellite soil moisture retrievals: What are (the) errors? Remote Sensing of Environment, 244, 111806.
Hersbach, H., Bell, B., Berrisford, P., Hirahara, S., Horányi, A., Muñoz-Sabater, J., Nicolas, J., Peubey, C., Radu, R., Schepers, D., Simmons, A., Soci, C., Abdalla, S., Abellan, X., Balsamo, G., Bechtold, P., Biavati, G., Bidlot, J., Bonavita, M., De Chiara, G., Dahlgren, P., Dee, D., Diamantakis, M., Dragani, R., Flemming, J., Forbes, R., Fuentes, M., Geer, A., Haimberger, L., Healy, S., Hogan, R.J., Hólm, E., Janisková, M., Keeley, S., Laloyaux, P., Lopez, P., Lupu, C., Radnoti, G., de Rosnay, P., Rozum, I., Vamborg, F., Villaume, S., & Thépaut, J.-N. 2020. The ERA5 global reanalysis. Quarterly Journal of the Royal Meteorological Society, 146, 1999-2049
Hillel, D. 2003. Soil physics and soil physical characteristics. In D. Hillel (Ed.), Introduction to environmental soil physics (pp. 3–17). Academic Press. https://doi.org/10.1016/B978-012348655-4/50002-2 (resource validated 3rd September 2025)
Hirschi, M., Stradiotti, P., Crezee, B., Dorigo, W., and Seneviratne, S. I. 2025. Potential of long-term satellite observations and reanalysis products for characterising soil drying: trends and drought events, Hydrol. Earth Syst. Sci., 29, 397–425, https://doi.org/10.5194/hess-29-397-2025 (resource validated 3rd September 2025)
Hirschi, M., Stradiotti, P., Preimesberger, W., Dorigo, W., & Kidd, R. 2024. ESA Climate Change Initiative Plus - Soil Moisture Product Validation and Intercomparison Report (PVIR) Supporting Product version v09.1 (issue 1.0). Zenodo. https://doi.org/10.5281/zenodo.13861146 (resource validated 3rd September 2025)
(JCGM), J. C. F. G. I. M. 2008. International vocabulary of metrology — Basic and general concepts and associated terms (VIM). VIM3: International Vocabulary of Metrology, 3, 104.
Justice, C., Belward, A., Morisette, J., Lewis, P., Privette, J. & Baret, F. 2000. Developments in the ‘validation’ of satellite sensor products for the study of the land surface. 21, 3383-3390.
Kidd, R., et al. 2024: Soil Moisture 2024: Target Requirements and Gap Analysis Document (TRGAD). Document ref: C3S2_312a_Lot4.WP3-TRGAD-SM-v3_202404_SM_TR_GA_i1.2, Available at: Soil Moisture 2024: Target Requirements and Gap Analysis Document (TRGAD) (resource validated 3rd September 2025)
Liu, Y.Y., Dorigo, W.A., Parinussa, R.M., De Jeu, R.A.M., Wagner, W., McCabe, M.F., Evans, J.P., & Van Dijk, A.I.J.M. 2012. Trend-preserving blending of passive and active microwave soil moisture retrievals. Remote Sensing of Environment, 123, 280-297
Liu, Y., Yang, Y., & Song, J. 2023. Variations in global soil moisture during the past decades: Climate or human causes? Water Resources Research, 59, e2023WR034915. https://doi.org/10.1029/2023WR034915 (resource validated 3rd September 2025)
Loew, A., Bell, W., Brocca, L., Bulgin, C. E., Burdanowitz, J., Calbet, X., Donner, R. V., Ghent, D., Gruber, A., Kaminski, T., Kinzel, J., Klepp, C., Lambert, J. C., Schaepman-Strub, G., Schroder, M. & Verhoelst, T. 2017. Validation practices for satellite-based Earth observation data across communities. Reviews of Geophysics, 55, 779–817.
Mann, H. B., & Whitney, D.R. 1947. “On a test of whether one of two random variables is stochastically larger than the other”, The Annals of Mathematical Statistics, Vol. 18, pp. 50-60.
Mittelbach, H., Seneviratne, S. I., Hirschi, M., Dorigo, W. A., Wagner, W., Parinussa, R. M., Scarrott, R., Dwyer, N., Haas, E., Rautianinen, K. & Lahoz, W. A. 2012. ESA CCI: Soil Moisture: Product Validation Plan.
Muñoz-Sabater, J., Dutra, E., Agustí-Panareda, A., Albergel, C., Arduini, G., Balsamo, G., Boussetta, S., Choulga, M., Harrigan, S., Hersbach, H., Martens, B., Miralles, D.G., Piles, M., Rodríguez-Fernández, N.J., Zsoter, E., Buontempo, C., & Thépaut, J.N. 2021. ERA5-Land: a state-of-the-art global reanalysis dataset for land applications. Earth Syst. Sci. Data, 13, 4349-4383
Owe, M., de jeu, R., & Holmes, T. 2008. Multisensor historical climatology of satellite-derived global land surface moisture. Journal of Geophysical Research-Earth Surface, 113, F01002
Parinussa, R., de Jeu, R., van den Schalie, R., Crow, W., Lei, F. & Holmes, T. 2016. A Quasi-Global Approach to Improve Day-Time Satellite Surface Soil Moisture Anomalies through the Land Surface Temperature Input. Climate, 4.
Pasik, A., Gruber, A., Preimesberger, W., De Santis, D., and Dorigo, W. 2023. Uncertainty estimation for a new exponential-filter-based long-term root-zone soil moisture dataset from Copernicus Climate Change Service (C3S) surface observations, Geosci. Model Dev., 16, 4957–4976, https://doi.org/10.5194/gmd-16-4957-2023 (resource validated 3rd September 2025)
Peel, M. C., Finlayson, B. L. & McMahon, T. A. 2007. Updated world map of the Köppen-Geiger climate classification. Hydrol. Earth Syst. Sci., 11, 1633-1644.
Plummer, S., Lecomte, P., & Doherty, M. 2017. The ESA Climate Change Initiative (CCI): A European contribution to the generation of the Global Climate Observing System. Remote Sensing of Environment
Preimesberger, W., Scanlon, T., Su, C.-H., Gruber, A., & Dorigo, W. 2021. Homogenization of Structural Breaks in the Global ESA CCI Soil Moisture Multisatellite Climate Data Record. IEEE Transactions on Geoscience and Remote Sensing, 59(4), 2845-2862. https://doi.org/10.1109/TGRS.2020.3012896 (resource validated 3rd September 2025)
Preimesberger W. et al. 2024. C3S Soil Moisture Version v202312: Product Quality Assessment Report. Document Ref. C3S2_312a_Lot4.WP2-FDDP-SM-v1_202212_SM_PQAR-v4_i1.2, Available at: https://confluence.ecmwf.int/pages/viewpage.action?pageId=445290728 (resource validated 3rd September 2025)
Preimesberger W. et al. 2025a. C3S Soil Moisture Version v202505: Product User Guide and Specification. Document ref: C3S2_313c_EODC_WP1-DDP-SSM-v1_202506_PUGS_i1.0; C3S2_313c_EODC_WP1-DDP-RZSM-v1_202506_PUGS_i1.0; C3S2_313c_EODC_WP1-DDP-FT-v1_202506_PUGS_i1.0. Available at https://confluence.ecmwf.int/x/9d6nHg (resource validated 3rd September 2025)
Preimesberger, W. et al. 2025b C3S Soil Moisture Version v202505: Algorithm Theoretical Basis Document. Document ref: C3S2_313c_EODC_WP1-DDP-SSM-v1_202506_ATBD_i2.0; C3S2_313c_EODC_WP1-DDP-RZSM-v1_202506_ATBD_i2.0; C3S2_313c_EODC_WP1-DDP-FT-v1_202506_ATBD_i2.0. Available at: https://confluence.ecmwf.int/x/8N6nHg (resource validated 3rd September 2025)
Rodell, M. et al., 2004. The Global Land Data Assimilation System. Bulletin of the American Meteorological Society, 85, pp.381–394
Song, Y., Su, J., Mou, T., Wen, J., Zhu, G., Wu, X. & Zheng, D. (2025) Improvement of rootzone soil moisture estimation over the Tibetan Plateau based on the exponential filter model and Copernicus Climate Change Service (C3S) surface observations. Journal of Hydrology, 662, 133882. Available at: https://doi.org/10.1016/j.jhydrol.2025.133882 (resource validated 23rd October 2025).
Steele-Dunne, S. C., Friesen, J. & van de Giesen, N. 2012. Using Diurnal Variation in Backscatter to Detect Vegetation Water Stress. Ieee Transactions on Geoscience and Remote Sensing, 50, 2618-2629.
Stradiotti, P., Gruber, A., Preimesberger, W., & Dorigo, W. 2025. Accounting for seasonal retrieval errors in the merging of multi-sensor satellite soil moisture products. Science of Remote Sensing, 12, 100242. https://doi.org/10.1016/j.srs.2025.100242 (resource validated 3rd September 2025)
Su, C.-H., Ryu, D., Dorigo, W., Zwieback, S., Gruber, A., Albergel, C., Reichle, R. H., and Wagner, W. 2016, Homogeneity of a global multisatellite soil moisture climate data record, Geophys. Res. Lett., 43, 11,245–11,252, doi:10.1002/2016GL070458.
Ticconi, F., Anderson, C., Figa-Saldana, J., Wilson, J.J.W., & Bauch, H. 2017. Analysis of Radio Frequency Interference in Metop ASCAT Backscatter Measurements. Ieee Journal of Selected Topics in Applied Earth Observations and Remote Sensing, 10, 2360-2371
van der Vliet, M., van der Schalie, R., Rodriguez-Fernandez, N., Colliander, A., de Jeu, R., Preimesberger, W., Scanlon, T., & Dorigo, W. (2020). Reconciling Flagging Strategies for Multi-Sensor Satellite Soil Moisture Climate Data Records. Remote Sensing, 12(20), 3439. https://doi.org/10.3390/rs12203439
van der Schalie, R., van der Vliet, M., Albergel, C., Dorigo, W., Wolski, P., and de Jeu, R. 2022. Characterizing natural variability in complex hydrological systems using passive microwave-based climate data records: a case study for the Okavango Delta, Hydrol. Earth Syst. Sci., 26, 3611–3627, https://doi.org/10.5194/hess-26-3611-2022 (resource validated 3rd September 2025)
Vargas Zeppetello, L.R., Trevino, A.M. & Huybers, P. Disentangling contributions to past and future trends in US surface soil moisture. Nat Water 2, 127–138 2024. https://doi.org/10.1038/s44221-024-00193-x (resource validated 3rd September 2025)
Vreugdenhil, M., Greimeister-Pfeil, I., Preimesberger, W., Camici, S., Dorigo, W., Enenkel, M., van der Schalie, R., Steele-Dunne, S. & Wagner, W. (2022) Microwave remote sensing for agricultural drought monitoring: Recent developments and challenges. Frontiers in Water, 4, 1045451. Available at: https://doi.org/10.3389/frwa.2022.1045451 (resource validated 23rd October 2025).
Wagner, W., Lemoine, G., & Rott, H. 1999. A Method for Estimating Soil Moisture from ERS Scatterometer and Soil Data. Remote Sensing of Environment, 70, 191-207
Wagner, W., Dorigo, W., de Jeu, R., Fernandez, D., Benveniste, J., Haas, E., & Ertl, M. 2012. Fusion of Active and Passive Microwave Observations To Create an Essential Climate Variable Data Record on Soil Moisture. ISPRS Annals of Photogrammetry, Remote Sensing and Spatial Information Sciences, I-7, 315–321
Wagner, W., Lindorfer, R., Hahn, S., Kim, H., Vreugdenhil, M., Gruber, A., Fischer, M., & Trnka, M. 2023. Global Scale Mapping of Subsurface Scattering Signals Impacting ASCAT Soil Moisture Retrievals. TechRxiv. https://doi.org/10.34726/4782 (resource validated 3rd September 2025)
Wilcoxon, F. 1945. Individual Comparisons by Ranking Methods, Biometrics Bulletin, Vol. 1, pp. 80-83. DOI:10.2307/3001968 (resource validated 3rd September 2025)
Zaussinger, F., Dorigo, W., Gruber, A., Tarpanelli, A., Filippucci, P., and Brocca, L. 2019. Estimating irrigation water use over the contiguous United States by combining satellite and reanalysis soil moisture data, Hydrol. Earth Syst. Sci., 23, 897–923, https://doi.org/10.5194/hess-23-897-2019 (resource validated 3rd September 2025)
Zappa, L.; Schlaffer, S.; Bauer-Marschallinger, B.; Nendel, C.; Zimmerman, B.; Dorigo, W. 2021. Detection and Quantification of Irrigation Water Amounts at 500 m Using Sentinel-1 Surface Soil Moisture. Remote Sens., 13, 1727. https://doi.org/10.3390/rs13091727 (resource validated 3rd September 2025)
Annex A - Differences between Satellite and Reanalysis Soil Moisture products
C3S provides soil moisture datasets from different sources. ERA5 and ERA5-Land reanalysis, as well as the here-described satellite products, provide information on global surface soil moisture. For many users, the questions arises of what agreement level is expected between them and which dataset is best suited for a specific application.
While both data types describe surface soil moisture, there are fundamental differences in how they are produced. Both are viable information sources and generally, they agree well with each other. Many studies, in which SM plays a crucial role, use both data sources to either confirm findings with a second, independent data source (e.g. ESotC report; Chapter 3) or by using them in conjunction to build on the individual strengths of each product.
Satellite soil moisture is derived from measurements of electromagnetic waves emitted from Earth in the (water-sensitive) microwave domain. Retrieval models are applied to estimate water content in a scene from the raw physical measurements, which contain information from all contributing processes at the surface. Reanalyses use the interactions between atmospheric and terrestrial fluxes to predict soil moisture, relying on precipitation measurements for forcing. C3S satellite soil moisture and in situ soil moisture measurements are not assimilated in ERA5 or ERA5-Land. In situ soil moisture is not used in the production of C3S satellite soil moisture. It is therefore expected that reanalysis SM performs well in areas with an abundance of precipitation measurements to predict large-scale conditions that are close to the climatic mean. In contrast, satellite measurements can directly capture extreme events, and short-term changes, which models are more difficult to calibrate for.
As was shown in Chapter 2.1.5.2, a comparison to the most reliable reference data available (in situ SM) shows a slightly higher agreement with the reanalysis data, compared to the satellite data globally. However, the quality of satellite (and reanalysis data) varies locally. Comparison to ISMN data suggests, that while the reanalysis data performs overall slightly better on a global scale, for ~36% of ISMN sensors a higher agreement is found with the satellite data (Figure 70).

Figure 70. Correlation with ISMN in situ FRMs for C3S Satellite (y-axis) and ERA5-Land soil moisture (x-axis), data after 2015-04-01 are used in all cases.
Points above the 1:1 line represent locations with a higher correlation between in situ and satellite observations, points below the line indicate a better performance of ERA5-Land.
There are several reasons why this can be the case. For example, irrigation signals are detected by satellites but are usually not accounted for by models (e.g., Zaussinger et al., 2019; Zappa et al., 2021). The same applies to other factors, especially in complex hydrological systems, such as soil moisture anomalies caused by lateral water influx from rivers. This was demonstrated by van der Schalie et al. (2022) for the Okavango Delta (Botswana), where some multi-year positive soil moisture anomalies were captured by the satellites but not adequately represented in ERA5-Land (Figure 71).

Figure 71. Anomalies for the Okavango River delta in satellite (top) and reanalysis (bottom) soil moisture. Figure taken from van der Schalie et al. (2022).
Reanalysis and satellite soil moisture are both used successfully for long-term trend studies (e.g. Vargas Zeppetello et al., 2024; Liu et al., 2023). However, when comparing long-term (multi-decadal) trends using simple (linear) methods, it is found that different satellite data sets (Figure 47) and model/reanalysis products contradict (Figure 72). It is therefore difficult to recommend one data type over the other for this application, which is the topic of research such as by Hirschi et al. (2025).
(a) |
(b) |
(c) | |


Figure 72. 2000-2021 soil moisture trends in ERA5-Land (a), MERRA2 (b), and GLDAS Noah (c). Figure taken from ESA CCI SM v8.1 PVIR (resource validated 3rd September 2025).
Apart from the characteristics described above, there are other notable differences between satellite and reanalysis soil moisture. C3S satellite SM includes uncertainty estimates, which can (and should) be used to assess the data quality and the uncertainty of the derived statistics. Another relevant point for many users concerns data gaps: Satellite observations often contain gaps, especially in winter, in locations where soil water content is frozen, whereas reanalyses provide gap-free fields. However, the quality of these estimates in winter is difficult to assess.
