| Name
|
Size
|
Creator |
Creation Date
|
Last Modification Date
|
Labels |
Attached To |
|
PNG File Fig10.2.14 Lightning HRES.png |
190 kB |
Bob Owens |
May 03, 2023 21:07 |
May 03, 2023 21:07 |
|
Page: Section 8.1.7 Point Rainfall
|
|
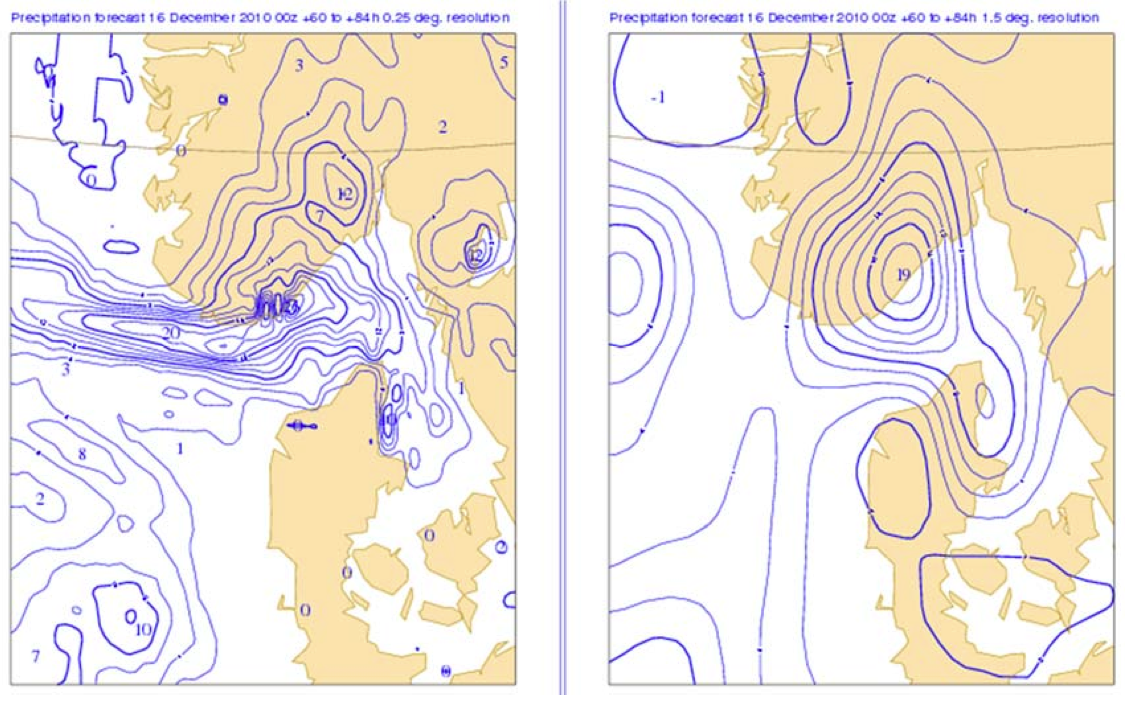
PNG File Fig10.2.12 Lightning Spacial Resolution.png |
608 kB |
Bob Owens |
May 03, 2023 21:07 |
May 03, 2023 21:07 |
|
Page: Section 8.1.7 Point Rainfall
|
|
PNG File Screenshot 2019-04-23 at 22.23.03.png |
192 kB |
Bob Owens |
May 02, 2023 20:48 |
May 02, 2023 20:48 |
|
Page: Section 8.1.17 Medium Range Regime Charts
|
|
GIF File 4Regimes_2up.gif |
156 kB |
Bob Owens |
May 02, 2023 20:48 |
May 02, 2023 20:48 |
|
Page: Section 8.1.17 Medium Range Regime Charts
|
|
PNG File NAO_and_BLO_modes_FUG_smaller.png |
363 kB |
Bob Owens |
May 02, 2023 20:48 |
May 02, 2023 20:48 |
|
Page: Section 8.1.17 Medium Range Regime Charts
|
|
PNG File Screenshot 2021-07-27 at 18.28.16.png |
70 kB |
Bob Owens |
May 02, 2023 20:48 |
May 02, 2023 20:48 |
|
Page: Section 8.1.17 Medium Range Regime Charts
|
|
GIF File 4Regimes_2up.gif |
156 kB |
Bob Owens |
May 02, 2023 20:46 |
May 02, 2023 20:46 |
|
Page: Section 7.4 Regime Charts
|
|
PNG File NAO_and_BLO_modes_FUG_smaller.png |
363 kB |
Bob Owens |
May 02, 2023 20:46 |
May 02, 2023 20:46 |
|
Page: Section 7.4 Regime Charts
|
|
PNG File Screenshot 2019-04-23 at 22.23.03.png |
192 kB |
Bob Owens |
May 02, 2023 20:46 |
May 02, 2023 20:46 |
|
Page: Section 7.4 Regime Charts
|
|
PNG File Regime_Histogram_2.png |
111 kB |
Bob Owens |
May 02, 2023 20:46 |
May 02, 2023 20:46 |
|
Page: Section 7.4 Regime Charts
|
|
PNG File Regime_Histogram_1.png |
173 kB |
Bob Owens |
May 02, 2023 20:46 |
May 02, 2023 20:46 |
|
Page: Section 7.4 Regime Charts
|
|
PNG File Screenshot 2019-03-18 at 09.49.38.png |
135 kB |
Bob Owens |
May 02, 2023 20:46 |
May 02, 2023 20:46 |
|
Page: Section 7.4 Regime Charts
|
|
PNG File Screenshot 2019-03-18 at 09.50.32.png |
155 kB |
Bob Owens |
May 02, 2023 20:46 |
May 02, 2023 20:46 |
|
Page: Section 7.4 Regime Charts
|
|
PNG File Screenshot 2019-03-18 at 09.51.00.png |
165 kB |
Bob Owens |
May 02, 2023 20:46 |
May 02, 2023 20:46 |
|
Page: Section 7.4 Regime Charts
|
|
PNG File EquinoxSoTCDF.png |
140 kB |
Bob Owens |
Apr 28, 2023 13:06 |
Apr 28, 2023 13:06 |
|
Page: Section 5.3.5 Limitations of twice weekly updates to the M-Climate
|
|
GIF File EquinoxSoTAnim.gif |
1.60 MB |
Bob Owens |
Apr 28, 2023 13:06 |
Apr 28, 2023 13:06 |
|
Page: Section 5.3.5 Limitations of twice weekly updates to the M-Climate
|
|
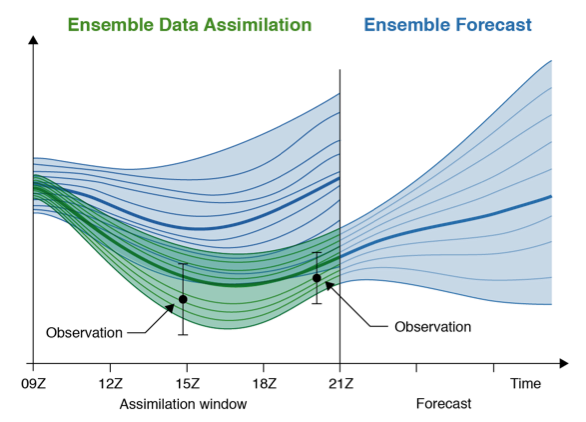
PNG File Fig5.1.2 EDA for ENS.png |
118 kB |
Bob Owens |
Apr 28, 2023 09:49 |
Apr 28, 2023 09:49 |
|
Page: Section 5.1.1 Ensemble of Data Assimilations - EDA
|
|
PNG File image-2023-4-27_11-28-25.png |
5.65 MB |
Bob Owens |
Apr 27, 2023 11:28 |
Apr 27, 2023 11:28 |
|
Page: Section 5.1 Generation of the Ensemble
|
|
PNG File Fig3.1.5 Example of poor interpolation.png |
839 kB |
Bob Owens |
Apr 26, 2023 20:03 |
Apr 26, 2023 20:03 |
|
Page: Section 3.4.2 Sub-gridscale Interpolation Effects
|
|
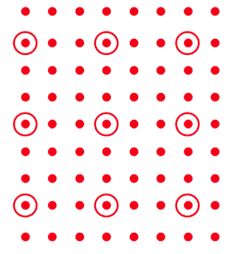
PNG File Fig8 Grid Interpolation.png |
25 kB |
Bob Owens |
Apr 26, 2023 20:03 |
Apr 26, 2023 20:03 |
|
Page: Section 3.4.2 Sub-gridscale Interpolation Effects
|