| Name
|
Size
|
Creator |
Creation Date
|
Last Modification Date
|
Labels |
Attached To |
|
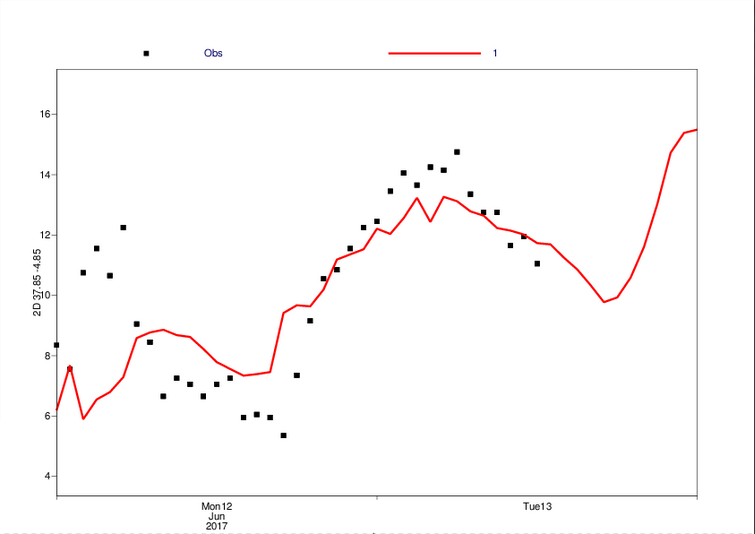
PNG File Fig6.5.3B ModelDewpointsHighCordoba.png |
41 kB |
Bob Owens |
Aug 25, 2022 10:08 |
Aug 25, 2022 10:08 |
|
Page: Section 9.2 Screen Level Temperatures and Moisture
|
|
PNG File Fig6.5.3B ModelDewpointsHighCordoba.png |
41 kB |
Bob Owens |
Aug 25, 2022 10:08 |
Aug 25, 2022 10:08 |
|
Page: Section 9.2.1 Causes of Errors in Forecast Temperature and Humidity
|
|
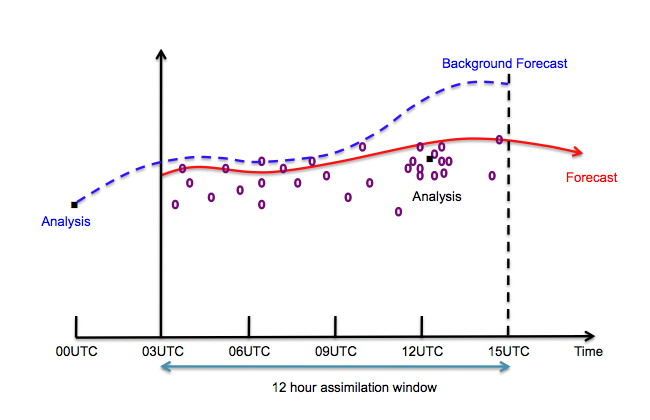
PNG File Fig2.5.1 Data Asimilation Diag1 .png |
40 kB |
Bob Owens |
Aug 23, 2022 16:23 |
Aug 23, 2022 16:23 |
|
Page: Section 2.5 Model Data Assimilation, 4D-Var
|
|
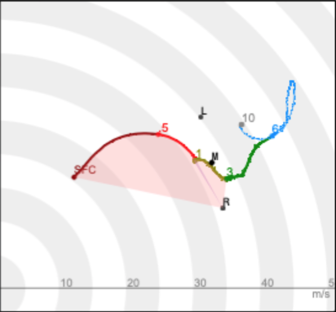
PNG File Screenshot 2024-01-01 at 16.54.22.png |
40 kB |
Bob Owens |
Jan 01, 2024 16:54 |
Jan 01, 2024 16:54 |
|
Page: Section 8.1.9.6 Forecasting Severe Convective Hazards
|
|
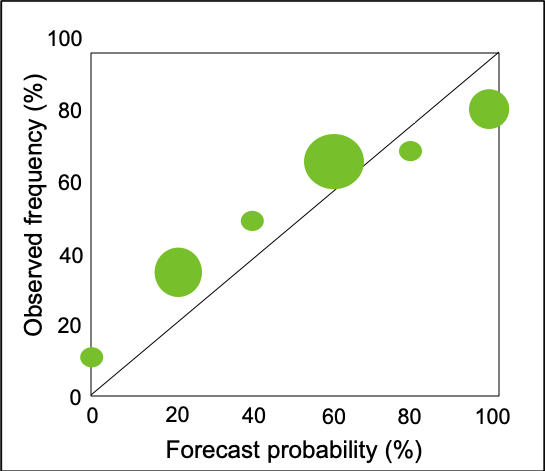
PNG File Screenshot 2022-07-19 at 11.03.43.png |
40 kB |
Bob Owens |
Jul 06, 2023 09:24 |
Jul 06, 2023 09:24 |
|
Page: Section 12.B Statistical Concepts - Probabilistic Data
|
|
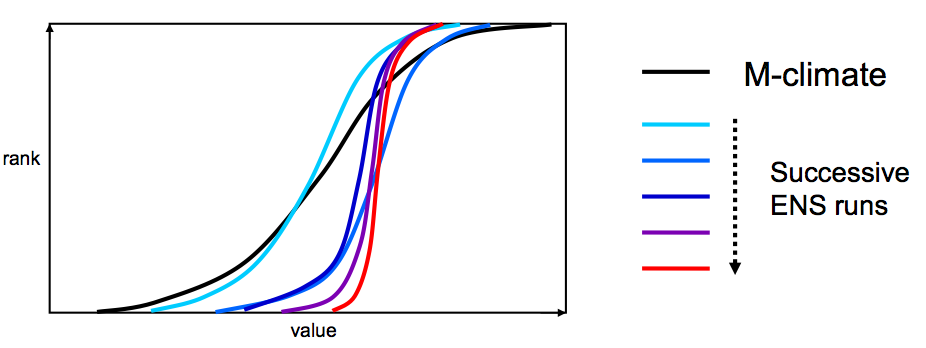
PNG File FigXZ3 Successive CDF.png |
39 kB |
Bob Owens |
Aug 23, 2022 17:46 |
Aug 23, 2022 17:46 |
|
Page: Section 8.1.9.2 Extreme Forecast Index - EFI
|
|
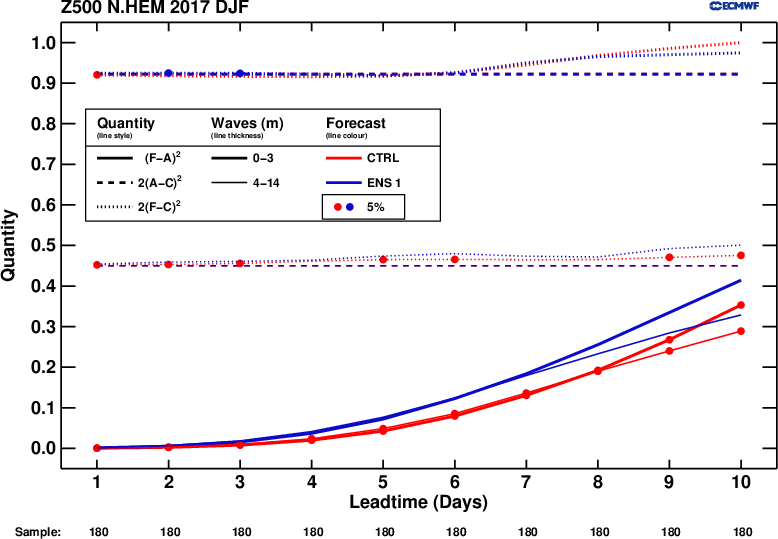
PNG File 2017_DJF_epsmember_Z500_NHEM_filtered.png |
38 kB |
Bob Owens |
Aug 23, 2022 17:14 |
Aug 23, 2022 17:14 |
|
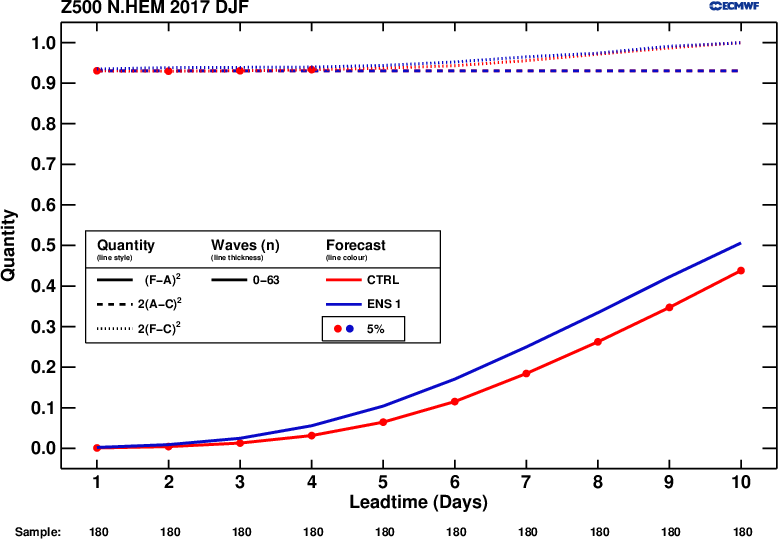
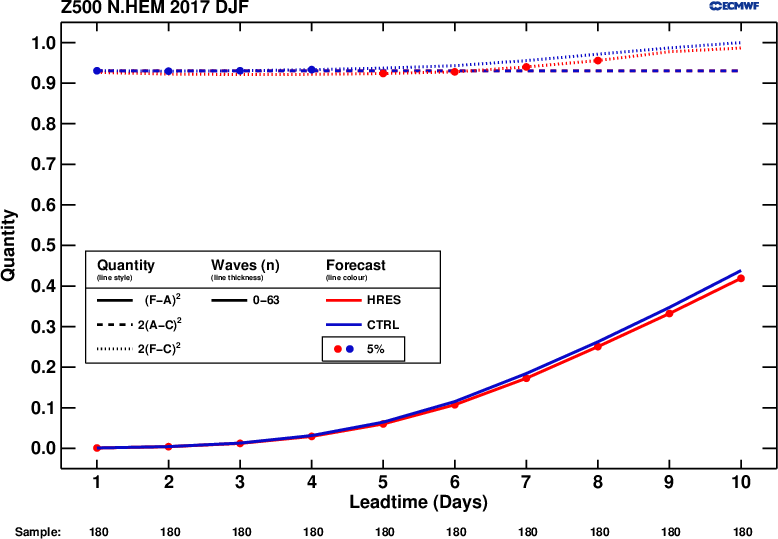
Page: Section 6.2.4 Relative error differences between models
|
|
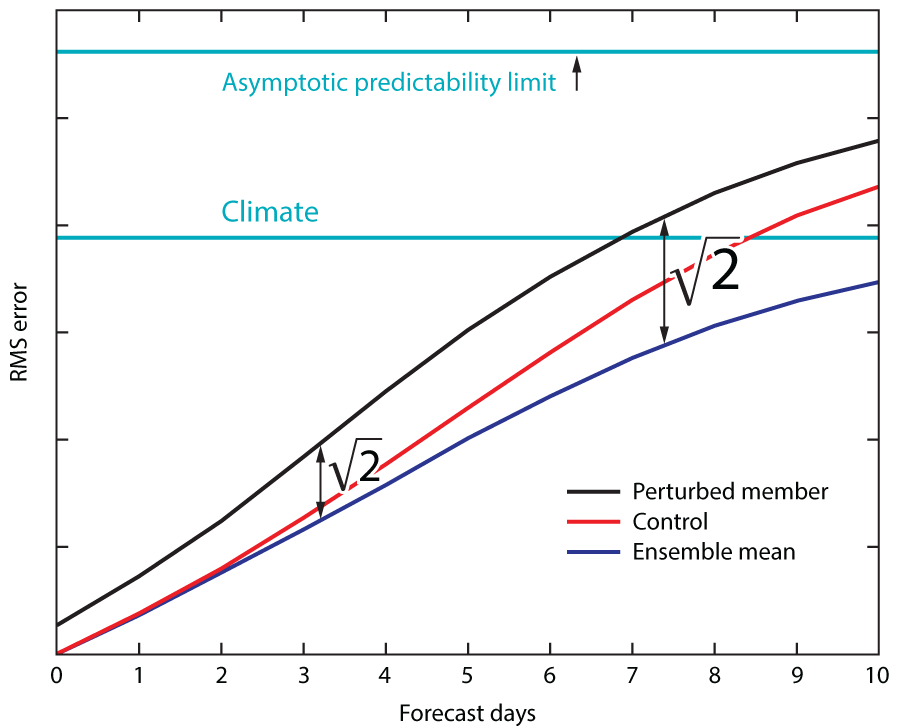
PNG File Fig5.1.6 Updated Prtrb vs Ctrl.png |
37 kB |
Bob Owens |
Oct 23, 2022 15:24 |
Oct 23, 2022 15:24 |
|
Page: Section 5.1 Generation of the Ensemble
|
|
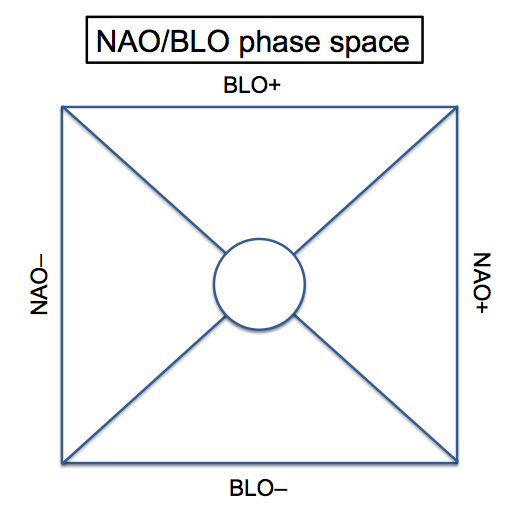
PNG File Fig8.12.22 NAO-BLO Phase Space.png |
37 kB |
Bob Owens |
Aug 25, 2022 09:56 |
Aug 25, 2022 09:56 |
|
Page: Section 8.2.2 Circulation patterns or Regimes
|
|
PNG File Fig8.8.3.5 Coupled:Uncoupled model pressures.png |
36 kB |
Bob Owens |
Jul 06, 2023 09:27 |
Jul 06, 2023 09:27 |
|
Page: Section 12.F Historical Techniques - Previous IFS cycles
|
|
PNG File Fig8.7.5.17 15Day Meteogram with Climate.png |
36 kB |
Bob Owens |
Aug 23, 2022 17:33 |
Aug 23, 2022 17:33 |
|
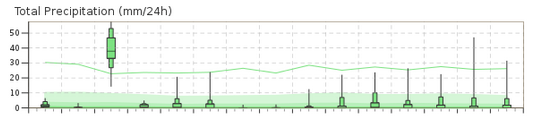
Page: Section 8.1.9.6 Forecasting Severe Convective Hazards
|
|
PNG File Fig8.8.3.10 Strike Prob Verification Stats 2.png |
35 kB |
Bob Owens |
Aug 23, 2022 18:02 |
Aug 23, 2022 18:02 |
|
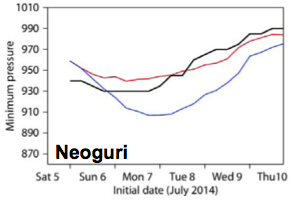
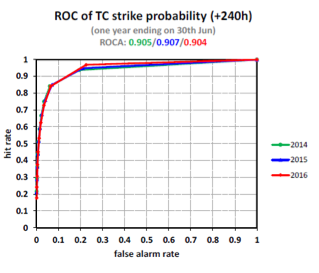
Page: Section 8.1.16.3 Considerations when using Tropical Cyclone products
|
|
PNG File CAPE & CIN Diagram.png |
35 kB |
Bob Owens |
Aug 23, 2022 18:08 |
Aug 23, 2022 18:08 |
|
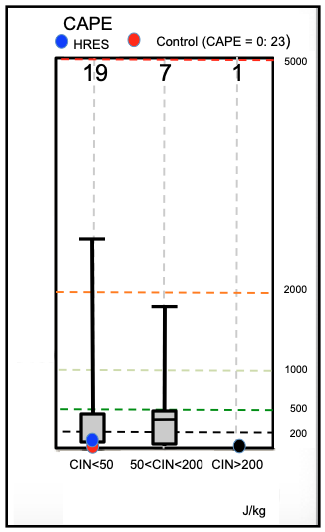
Page: Section 8.1.8 Vertical Profiles
|
|
PNG File Fig2.4.1 Data Sources.png |
34 kB |
Bob Owens |
Aug 23, 2022 16:39 |
Aug 23, 2022 16:39 |
|
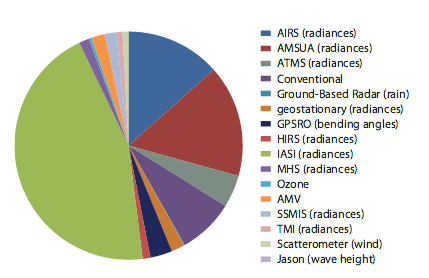
Page: Section 2.4 Atmospheric Model Data Sources
|
|
PNG File GridHRESIoW.png |
33 kB |
Bob Owens |
Sept 06, 2022 20:58 |
Sept 06, 2022 20:58 |
|
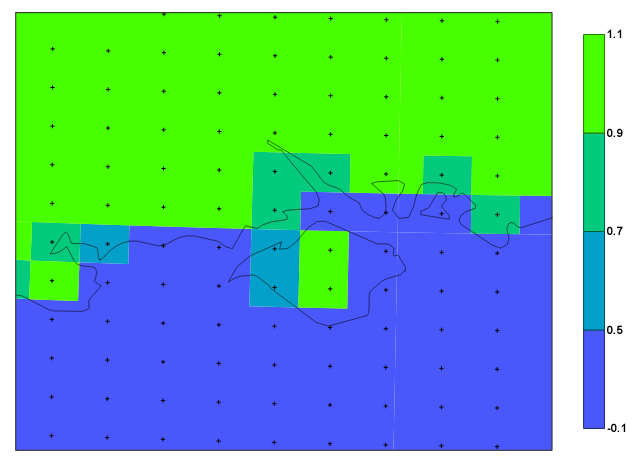
Page: Section 2.1.3.1 Land-Sea Mask
|
|
PNG File 2017_DJF_epsmember_Z500_NHEM_unfiltered.png |
32 kB |
Bob Owens |
Aug 23, 2022 17:14 |
Aug 23, 2022 17:14 |
|
Page: Section 6.2.4 Relative error differences between models
|
|
PNG File 2017_DJF_control_Z500_NHEM_unfiltered.png |
32 kB |
Bob Owens |
Aug 23, 2022 17:14 |
Aug 23, 2022 17:14 |
|
Page: Section 6.2.4 Relative error differences between models
|
|
PNG File Screenshot 2023-06-30 at 17.36.01.png |
32 kB |
Bob Owens |
Jun 30, 2023 17:36 |
Jun 30, 2023 17:36 |
|
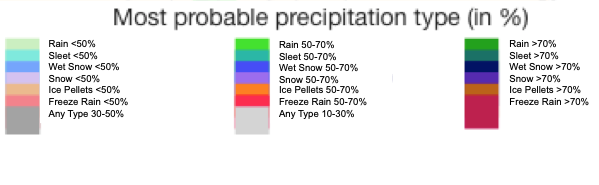
Page: Section 8.1.10 Types of Precipitation - charts and diagrams
|
|
PNG File Screenshot 2021-04-30 at 11.20.18.png |
30 kB |
Bob Owens |
Apr 26, 2023 20:03 |
Apr 26, 2023 20:03 |
|
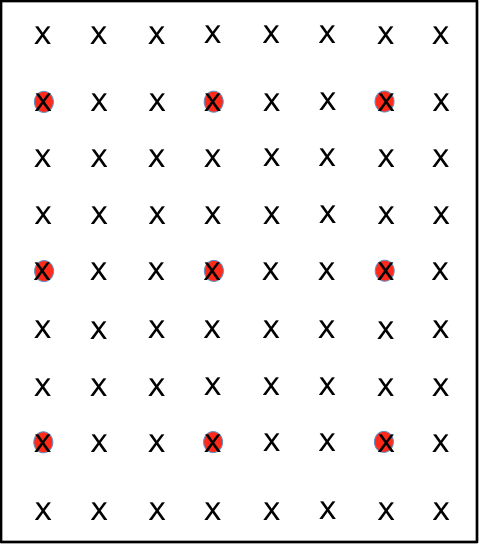
Page: Section 3.4.2 Sub-gridscale Interpolation Effects
|
|
PNG File Fig7 Grid interpolation.png |
30 kB |
Bob Owens |
Apr 26, 2023 20:03 |
Apr 26, 2023 20:03 |
|
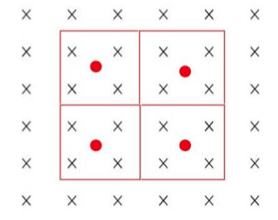
Page: Section 3.4.2 Sub-gridscale Interpolation Effects
|