| Name
|
Size
|
Creator |
Creation Date
|
Last Modification Date
|
Labels |
Attached To |
|
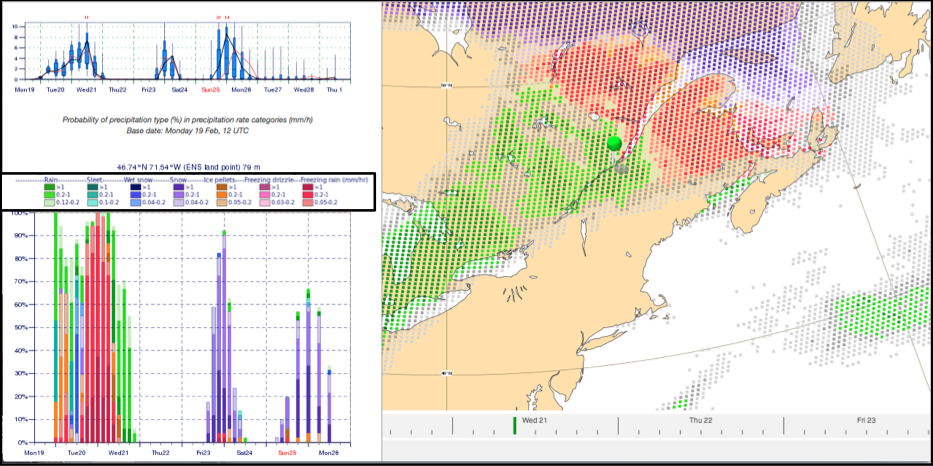
PNG File Screenshot 2023-06-28 at 19.39.37.png |
475 kB |
Bob Owens |
Jun 28, 2023 19:40 |
Jun 28, 2023 19:40 |
|
Page: Section 8.1.10 Types of Precipitation - charts and diagrams
|
|
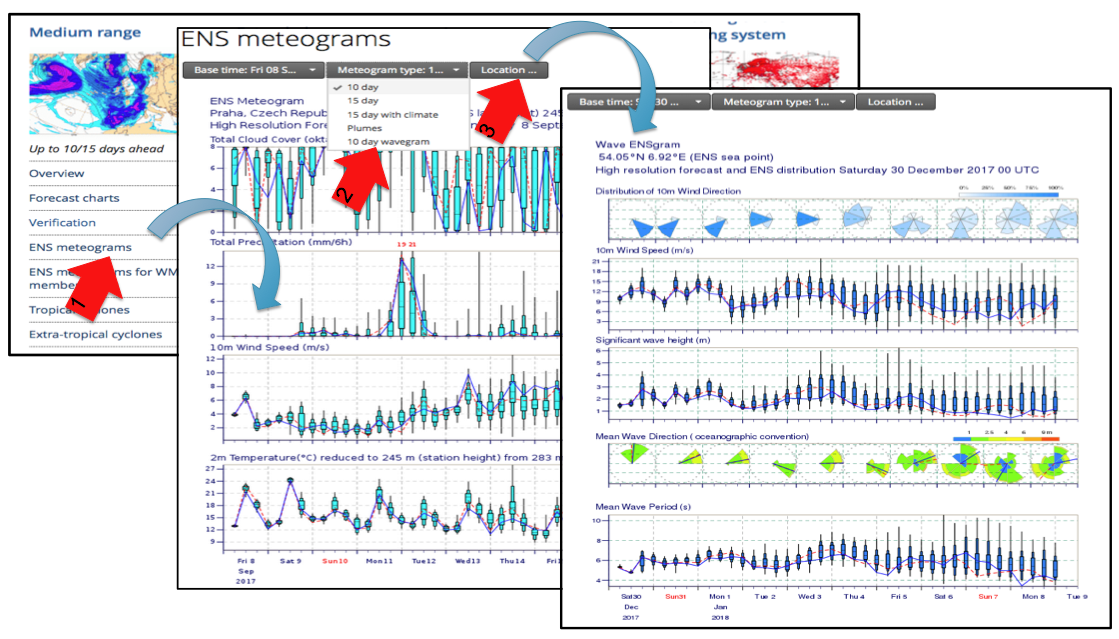
PNG File Fig8.4.1 Access to Wavegrams.png |
475 kB |
Bob Owens |
Aug 23, 2022 17:54 |
Aug 23, 2022 17:54 |
|
Page: Section 8.1.5 Waves and Wave Meteograms
|
|
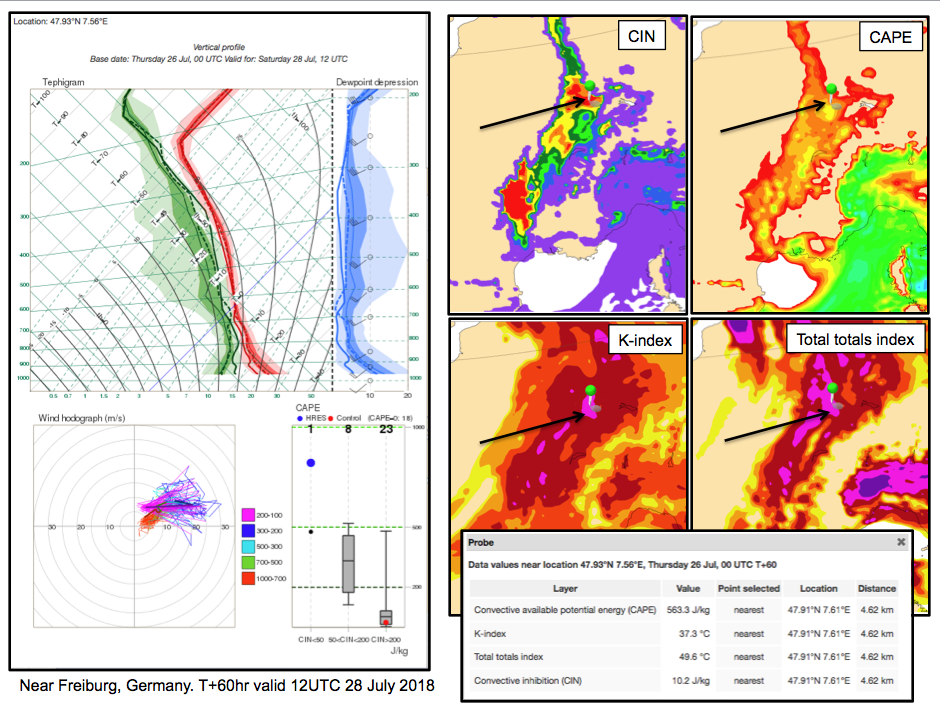
PNG File Fig8.7.6.25 Composite Indices Germany.png |
475 kB |
Bob Owens |
Aug 25, 2022 10:13 |
Aug 25, 2022 10:13 |
|
Page: Section 9.6.2 Instability Indices
|
|
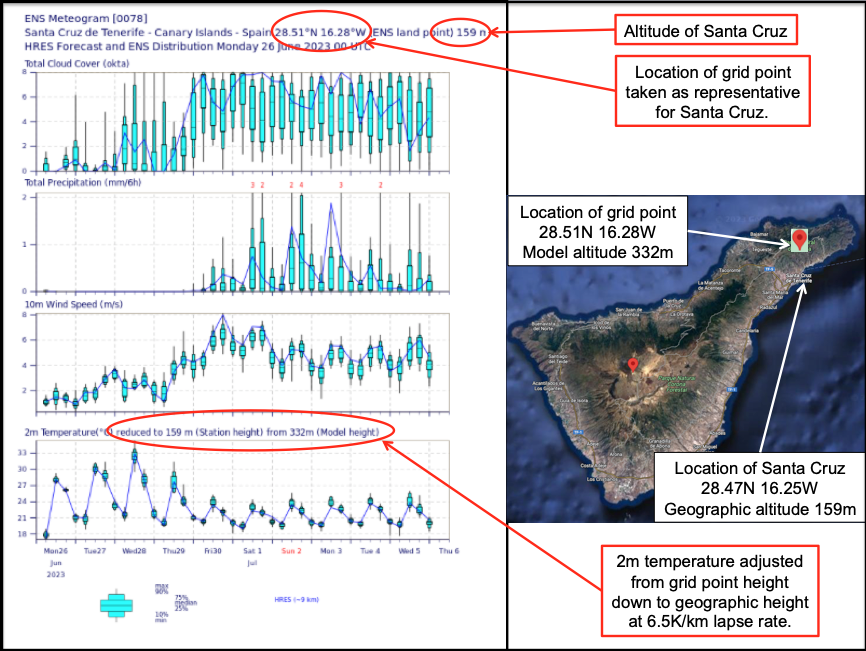
PNG File Screenshot 2023-06-26 at 22.53.05.png |
473 kB |
Bob Owens |
Jun 26, 2023 22:53 |
Jun 26, 2023 22:53 |
|
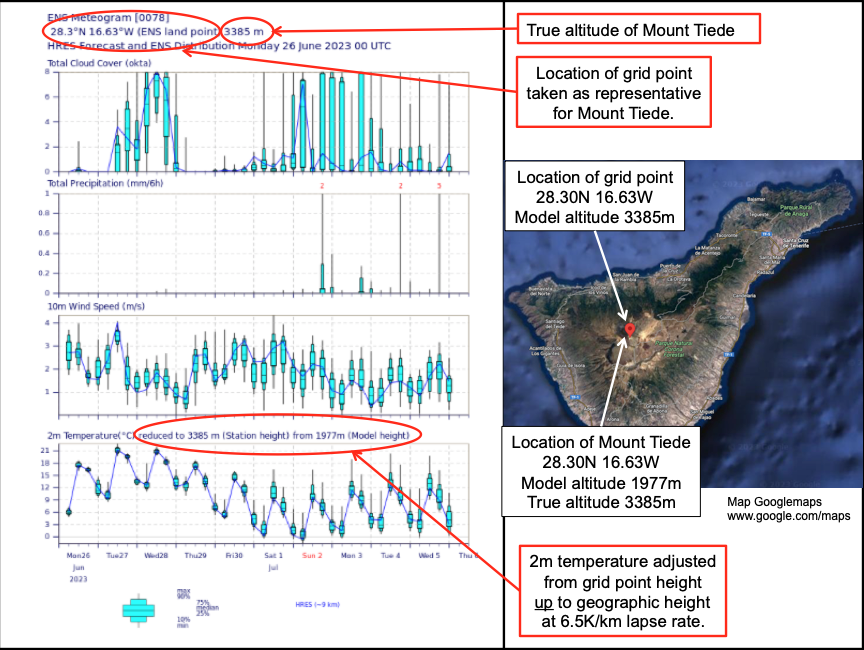
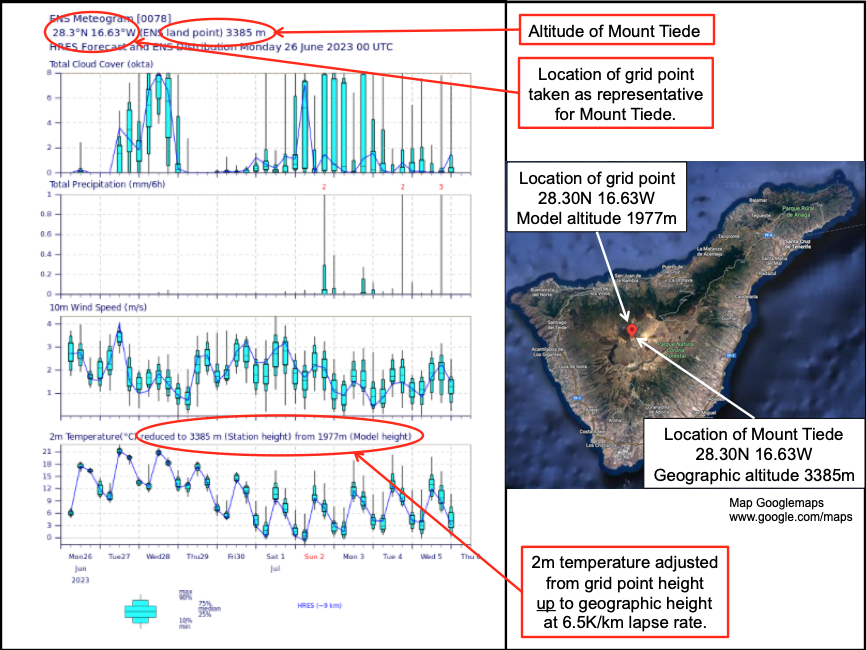
Page: Section 8.1.4.1 Selection of grid points for Meteograms
|
|
PNG File Screenshot 2023-10-20 at 19.35.52.png |
473 kB |
Bob Owens |
Mar 14, 2024 12:16 |
Mar 14, 2024 12:16 |
|
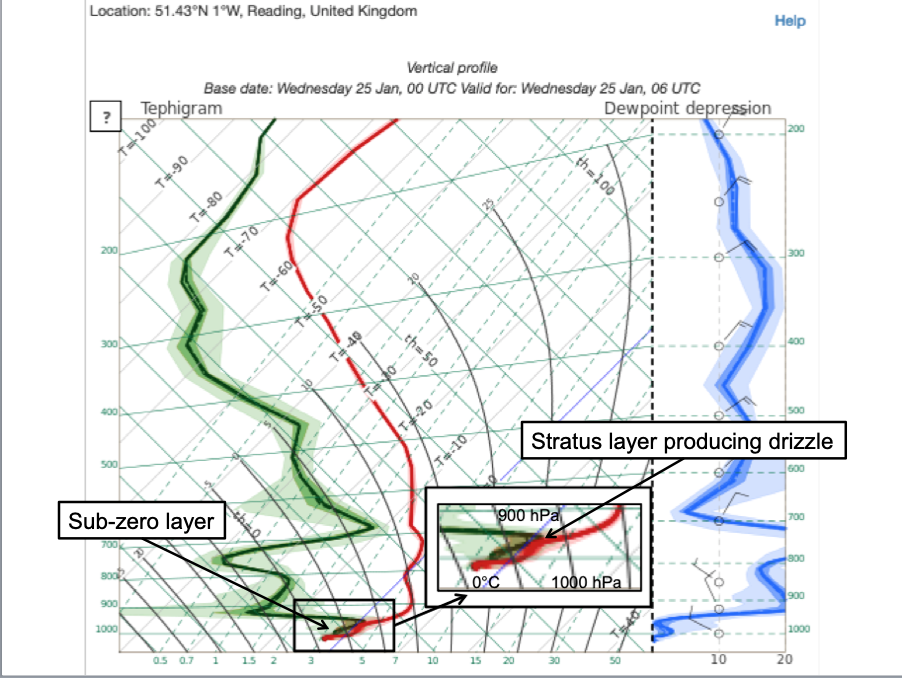
Page: Section8.1.10.1 Examples of freezing precipitation - charts and diagrams
|
|
PNG File Screenshot 2023-10-20 at 19.35.52.png |
473 kB |
Bob Owens |
Oct 20, 2023 19:36 |
Oct 20, 2023 19:36 |
|
Page: Section 8.1.10 Types of Precipitation - charts and diagrams
|
|
PNG File Screenshot 2021-07-25 at 14.55.49.png |
471 kB |
Bob Owens |
Aug 23, 2022 17:56 |
Aug 23, 2022 17:56 |
|
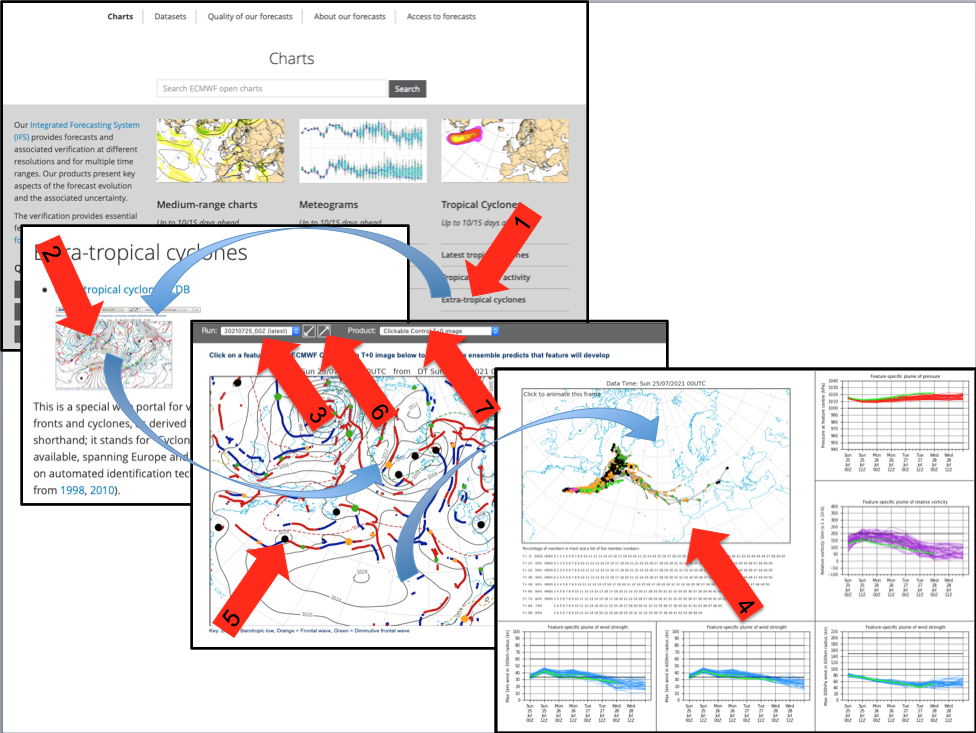
Page: Section 8.1.15 Extra-tropical Cyclone Diagrams
|
|
PNG File Screenshot 2021-07-25 at 14.59.30.png |
470 kB |
Bob Owens |
Aug 23, 2022 17:56 |
Aug 23, 2022 17:56 |
|
Page: Section 8.1.15 Extra-tropical Cyclone Diagrams
|
|
PNG File Screenshot 2021-07-25 at 15.01.30.png |
470 kB |
Bob Owens |
Aug 23, 2022 17:56 |
Aug 23, 2022 17:56 |
|
Page: Section 8.1.15 Extra-tropical Cyclone Diagrams
|
|
PNG File Screenshot 2023-02-14 at 16.22.51.png |
468 kB |
Bob Owens |
Mar 05, 2023 11:33 |
Mar 05, 2023 11:33 |
|
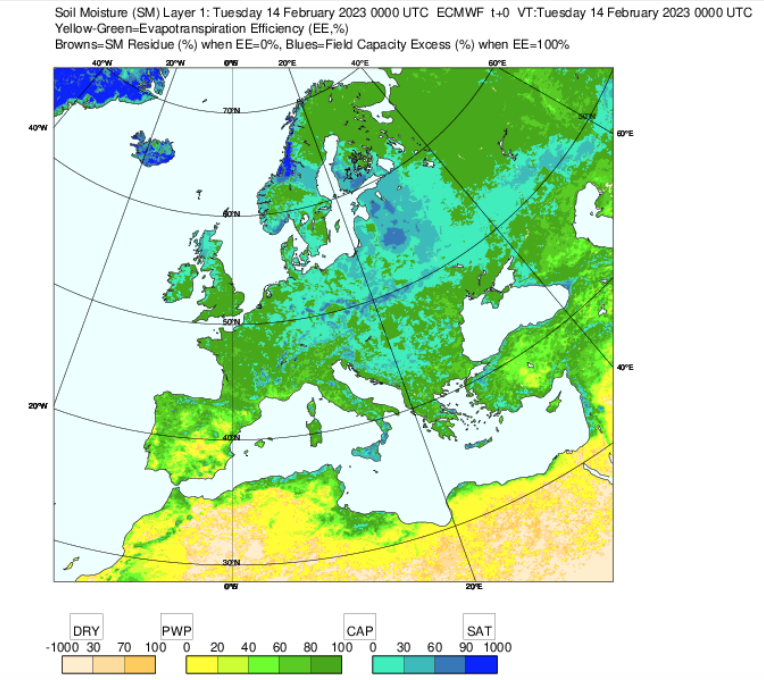
Page: Section 2.1.4.5 Modelling soil structure
|
|
PNG File Screenshot 2023-07-02 at 11.57.08.png |
463 kB |
Bob Owens |
Jul 02, 2023 12:14 |
Jul 02, 2023 12:14 |
|
Page: Section 8.1.4.1 Selection of grid points for Meteograms
|
|
PNG File Screenshot 2023-07-02 at 12.19.50.png |
463 kB |
Bob Owens |
Jul 02, 2023 12:20 |
Jul 02, 2023 12:20 |
|
Page: Section 8.1.4.1 Selection of grid points for Meteograms
|
|
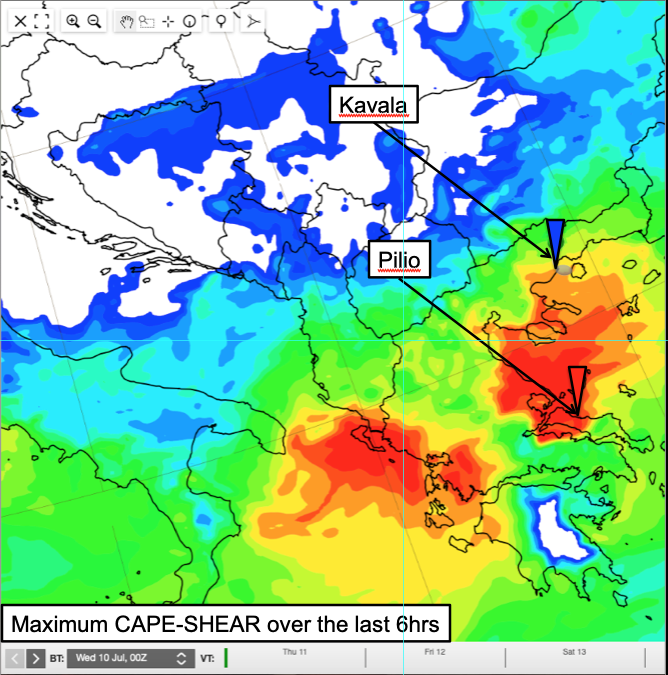
PNG File InstabilityIdent Max CAPESHEAR last 6hrs.png |
462 kB |
Bob Owens |
May 08, 2023 12:55 |
May 08, 2023 12:55 |
|
Page: Section 9.6 Convective Precipitation
|
|
PNG File InstabilityIdent Max CAPESHEAR last 6hrs.png |
462 kB |
Bob Owens |
May 08, 2023 13:14 |
May 08, 2023 13:14 |
|
Page: Section 9.6.1 Examples of convection problems
|
|
PNG File InstabilityIdent Max CAPESHEAR last 6hrs.png |
462 kB |
Bob Owens |
Sept 06, 2022 21:10 |
Sept 06, 2022 21:10 |
|
Page: Section 2.1.5.4 Convective Cloud Processes and Precipitation
|
|
PNG File Screenshot 2023-06-27 at 17.54.39.png |
462 kB |
Bob Owens |
Jun 27, 2023 17:56 |
Jun 27, 2023 17:56 |
|
Page: Section 8.1.4.1 Selection of grid points for Meteograms
|
|
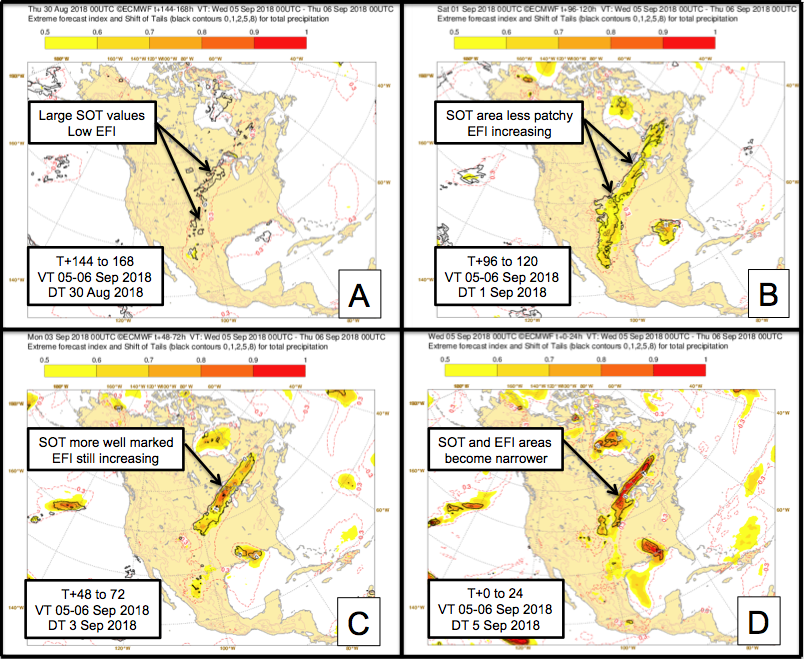
PNG File Fig8.7.6.28 EFI&SOT 4up 5Sep18.png |
461 kB |
Bob Owens |
Aug 23, 2022 17:35 |
Aug 23, 2022 17:35 |
|
Page: Section 8.1.9.7 EFI Charts
|
|
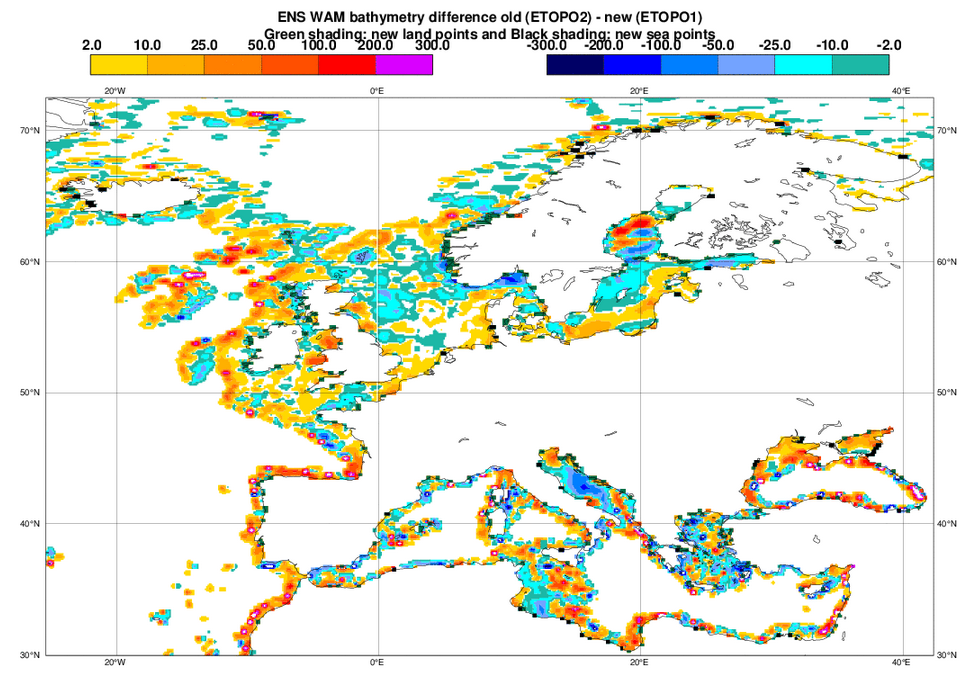
PNG File Fig12.4 Bathymetry ENS WAM Diff.png |
460 kB |
Bob Owens |
Jul 06, 2023 09:27 |
Jul 06, 2023 09:27 |
|
Page: Section 12.F Historical Techniques - Previous IFS cycles
|
|
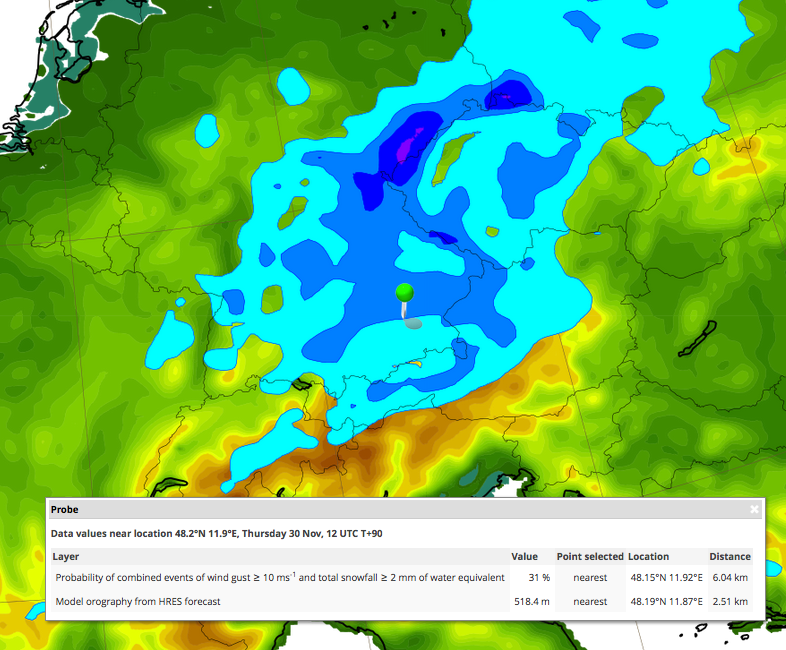
PNG File Fig8.1.12 ProbSnowAndWind.png |
460 kB |
Bob Owens |
Aug 23, 2022 17:25 |
Aug 23, 2022 17:25 |
|
Page: Section 8.1.1 Basic ensemble products
|
|
PNG File Screenshot 2023-03-16 at 21.48.58.png |
458 kB |
Bob Owens |
Mar 18, 2023 09:45 |
Mar 18, 2023 09:45 |
|
Page: Section 9.3 Surface Wind
|