| Name
|
Size
|
Creator |
Creation Date
|
Last Modification Date
|
Labels |
Attached To |
|
PNG File Fig7.7.3.8 EFI CAPEShear T+24 with Mclimate.png |
482 kB |
Bob Owens |
Nov 12, 2024 10:59 |
Nov 12, 2024 10:59 |
|
Page: Section 8.1.9.6 Forecasting severe convective hazards
|
|
PNG File Screenshot 2023-07-09 at 09.41.34.png |
482 kB |
Bob Owens |
Nov 12, 2024 10:58 |
Nov 12, 2024 10:58 |
|
Page: Section 2.2 Ocean Wave Model - ECWAM
|
|
PNG File Screenshot 2024-03-18 at 20.10.19.png |
481 kB |
Bob Owens |
Nov 12, 2024 10:59 |
Nov 12, 2024 10:59 |
|
Page: Section 8.1.4 Meteograms
|
|
PNG File Fig8.2.2A Normalised Mean&Spread.png |
481 kB |
Bob Owens |
Nov 12, 2024 10:59 |
Nov 12, 2024 10:59 |
|
Page: Section 8.1.2 ENS Mean and spread
|
|
PNG File Screenshot 2024-02-19 at 22.39.59.png |
480 kB |
Bob Owens |
Nov 12, 2024 10:58 |
Nov 12, 2024 10:58 |
|
Page: Section 2.1.4.5 Modelling soil structure
|
|
PNG File Screenshot 2019-03-16 at 15.26.10.png |
479 kB |
Bob Owens |
Nov 12, 2024 10:59 |
Nov 12, 2024 10:59 |
|
Page: Section 8.2.2 Circulation patterns or Regimes
|
|
PNG File Screenshot 2019-03-16 at 15.26.10.png |
479 kB |
Bob Owens |
Nov 12, 2024 11:00 |
Nov 12, 2024 11:00 |
|
Page: Section 8.2.6 Madden-Julian Oscillation Output
|
|
PNG File Screenshot 2019-03-16 at 15.26.10.png |
479 kB |
Bob Owens |
Nov 12, 2024 11:00 |
Nov 12, 2024 11:00 |
|
Page: Section 8.2.8 Teleconnections
|
|
PNG File Screenshot 2023-10-29 at 17.24.03.png |
479 kB |
Bob Owens |
Nov 12, 2024 11:00 |
Nov 12, 2024 11:00 |
|
Page: Section 8.3.1 Chart output
|
|
PNG File Screenshot 2024-02-19 at 17.09.58.png |
477 kB |
Bob Owens |
Nov 12, 2024 10:58 |
Nov 12, 2024 10:58 |
|
Page: Section 2.1.4.5 Modelling soil structure
|
|
PNG File Santa Cruz.png |
476 kB |
Bob Owens |
Nov 12, 2024 10:59 |
Nov 12, 2024 10:59 |
|
Page: Section 8.1.4.1 Selection of grid points for meteograms
|
|
PNG File Screenshot 2023-07-02 at 11.56.57.png |
476 kB |
Bob Owens |
Nov 12, 2024 10:59 |
Nov 12, 2024 10:59 |
|
Page: Section 8.1.4.1 Selection of grid points for meteograms
|
|
PNG File Screenshot 2023-06-28 at 19.39.37.png |
475 kB |
Bob Owens |
Nov 12, 2024 10:59 |
Nov 12, 2024 10:59 |
|
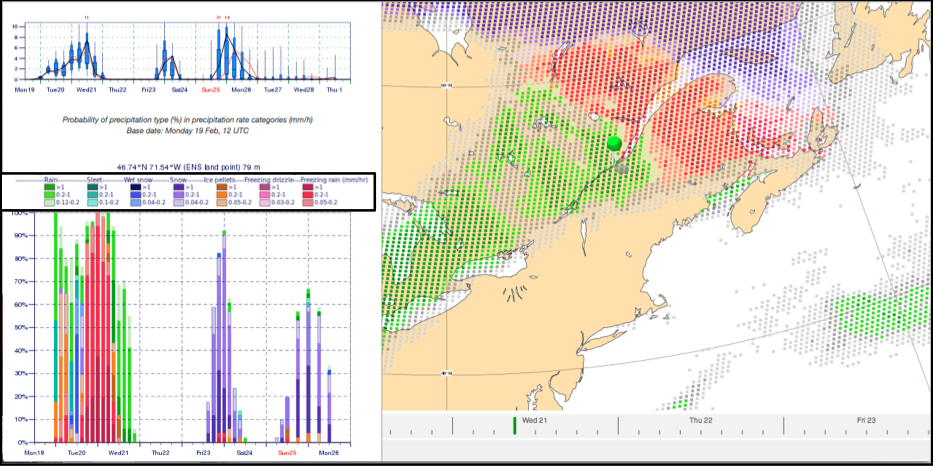
Page: Section 8.1.10 Types of precipitation - charts and diagrams
|
|
PNG File Fig8.4.1 Access to Wavegrams.png |
475 kB |
Bob Owens |
Nov 12, 2024 10:59 |
Nov 12, 2024 10:59 |
|
Page: Section 8.1.5 Waves and wave meteograms
|
|
PNG File Fig8.7.6.25 Composite Indices Germany.png |
475 kB |
Bob Owens |
Nov 12, 2024 11:00 |
Nov 12, 2024 11:00 |
|
Page: Section 9.6.7 Instability Indices
|
|
PNG File Screenshot 2023-06-26 at 22.53.05.png |
473 kB |
Bob Owens |
Nov 12, 2024 10:59 |
Nov 12, 2024 10:59 |
|
Page: Section 8.1.4.1 Selection of grid points for meteograms
|
|
PNG File Screenshot 2023-10-20 at 19.35.52.png |
473 kB |
Bob Owens |
Nov 12, 2024 10:59 |
Nov 12, 2024 10:59 |
|
Page: Section 8.1.10.1 Examples of freezing precipitation - charts and diagrams
|
|
PNG File Screenshot 2023-10-20 at 19.35.52.png |
473 kB |
Bob Owens |
Nov 12, 2024 10:59 |
Nov 12, 2024 10:59 |
|
Page: Section 8.1.10 Types of precipitation - charts and diagrams
|
|
PNG File Screenshot 2021-07-25 at 14.55.49.png |
471 kB |
Bob Owens |
Nov 12, 2024 10:59 |
Nov 12, 2024 10:59 |
|
Page: Section 8.1.15 Extra-tropical cyclone diagrams
|
|
PNG File Screenshot 2021-07-25 at 14.59.30.png |
470 kB |
Bob Owens |
Nov 12, 2024 10:59 |
Nov 12, 2024 10:59 |
|
Page: Section 8.1.15 Extra-tropical cyclone diagrams
|