| Name
|
Size
|
Creator |
Creation Date
|
Last Modification Date
|
Labels |
Attached To |
|
PNG File Screenshot 2023-02-16 at 16.42.24.png |
422 kB |
Bob Owens |
Feb 16, 2023 16:48 |
Feb 16, 2023 16:48 |
|
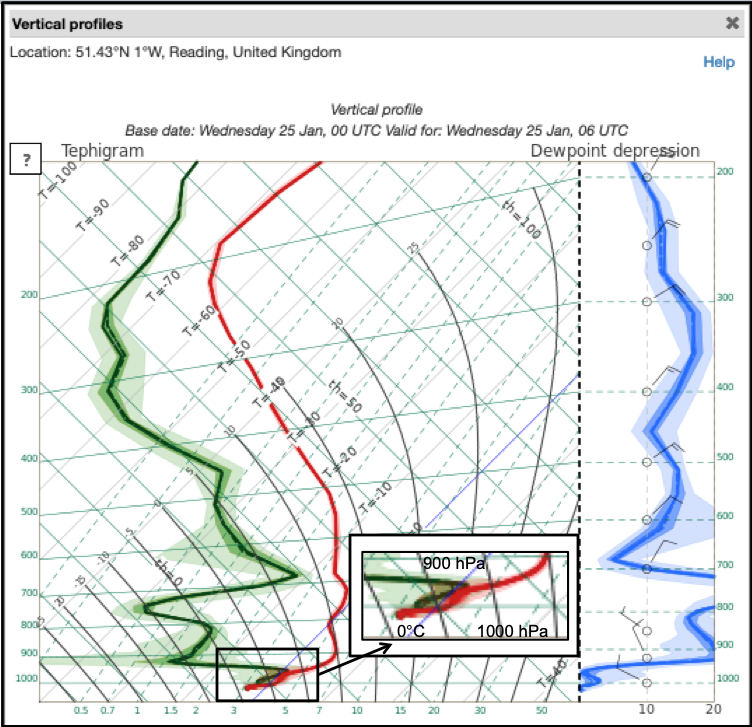
Page: Section 8.1.10 Types of Precipitation - charts and diagrams
|
|
PNG File Fig8.3.11BB Grid Points Canaries HRES.png |
422 kB |
Bob Owens |
Aug 23, 2022 17:40 |
Aug 23, 2022 17:40 |
|
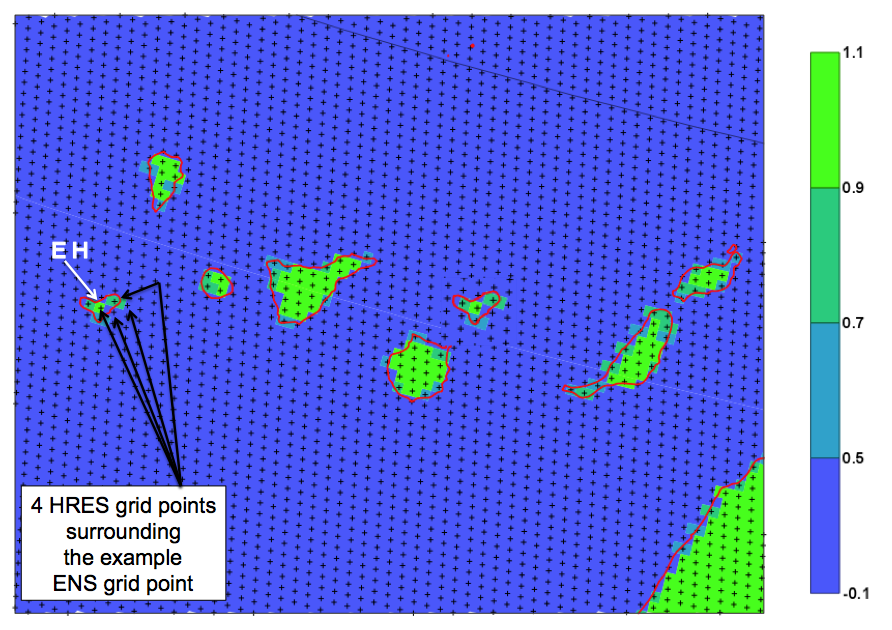
Page: Section 8.1.4 Meteograms
|
|
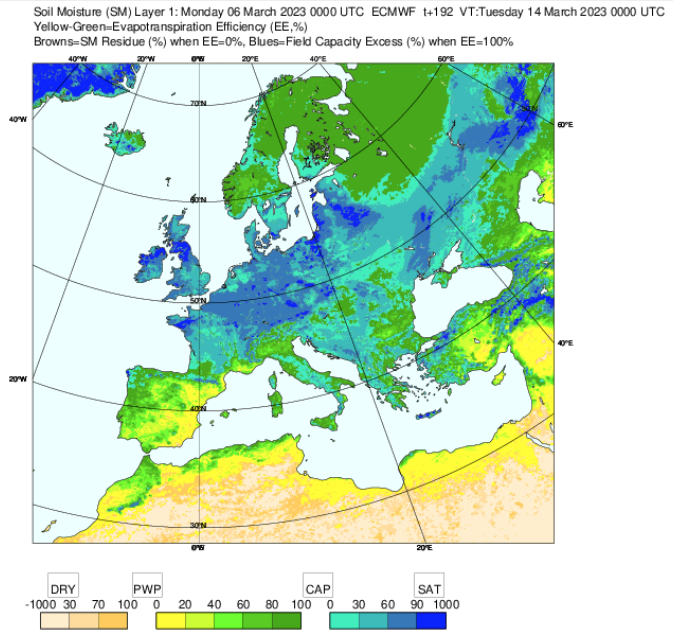
PNG File Screenshot 2023-03-06 at 17.21.48.png |
419 kB |
Bob Owens |
Mar 06, 2023 17:22 |
Mar 06, 2023 17:22 |
|
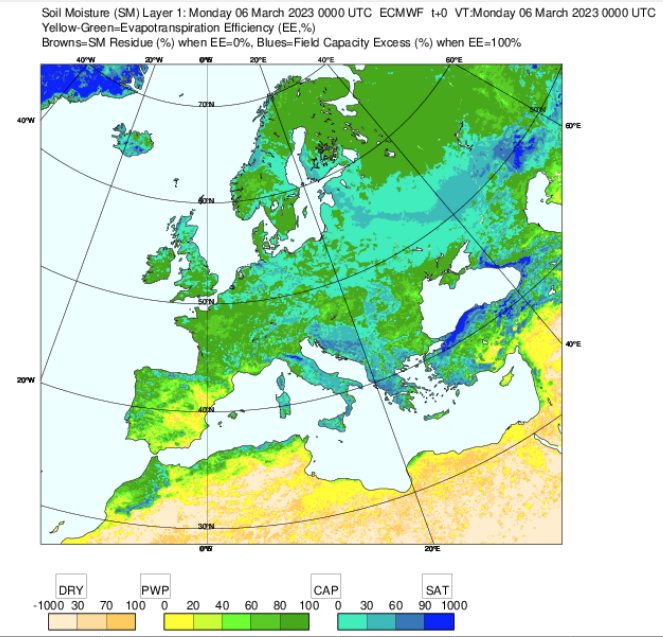
Page: Section 2.1.4.5 Modelling soil structure
|
|
PNG File Screenshot 2024-03-11 at 19.58.06.png |
417 kB |
Bob Owens |
Mar 14, 2024 12:14 |
Mar 14, 2024 12:14 |
|
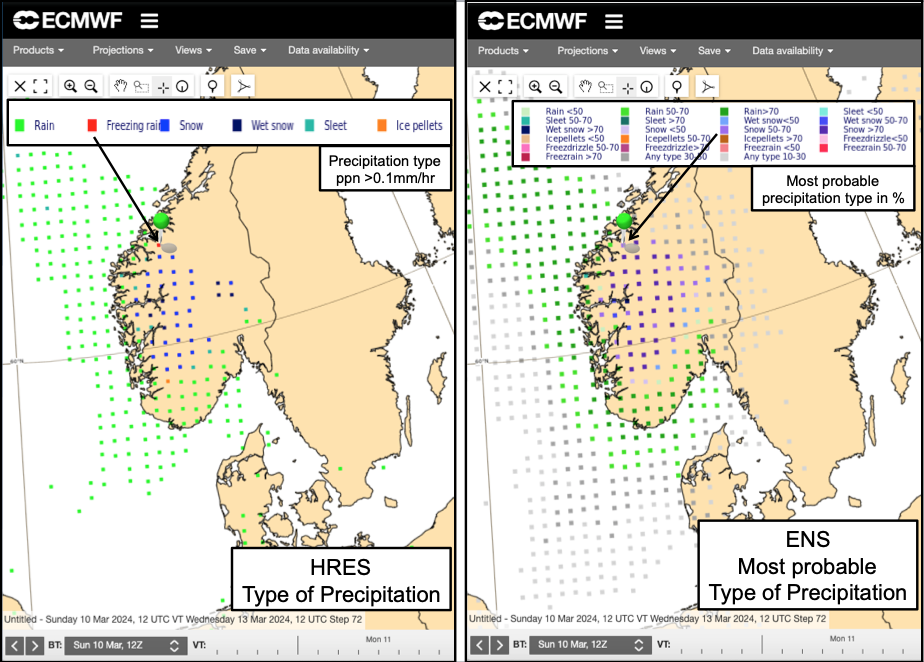
Page: Section 8.1.10 Types of Precipitation - charts and diagrams
|
|
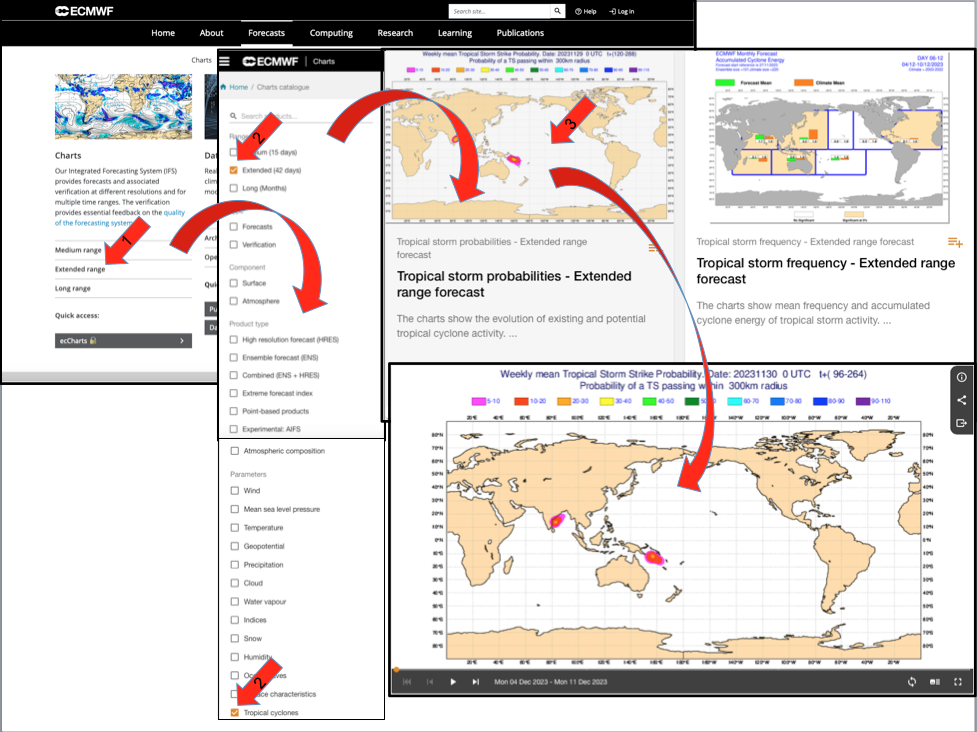
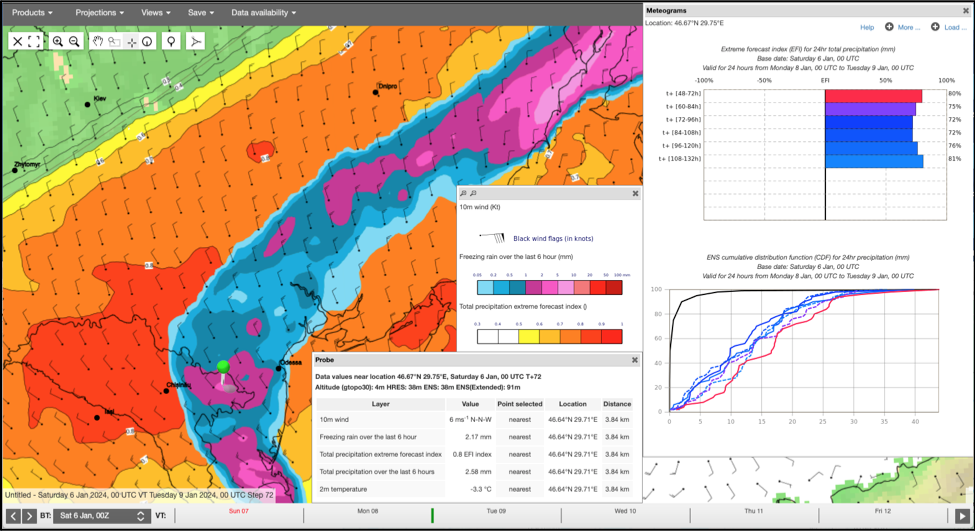
PNG File Screenshot 2023-12-01 at 11.28.33.png |
416 kB |
Bob Owens |
Dec 01, 2023 11:29 |
Dec 01, 2023 11:29 |
|
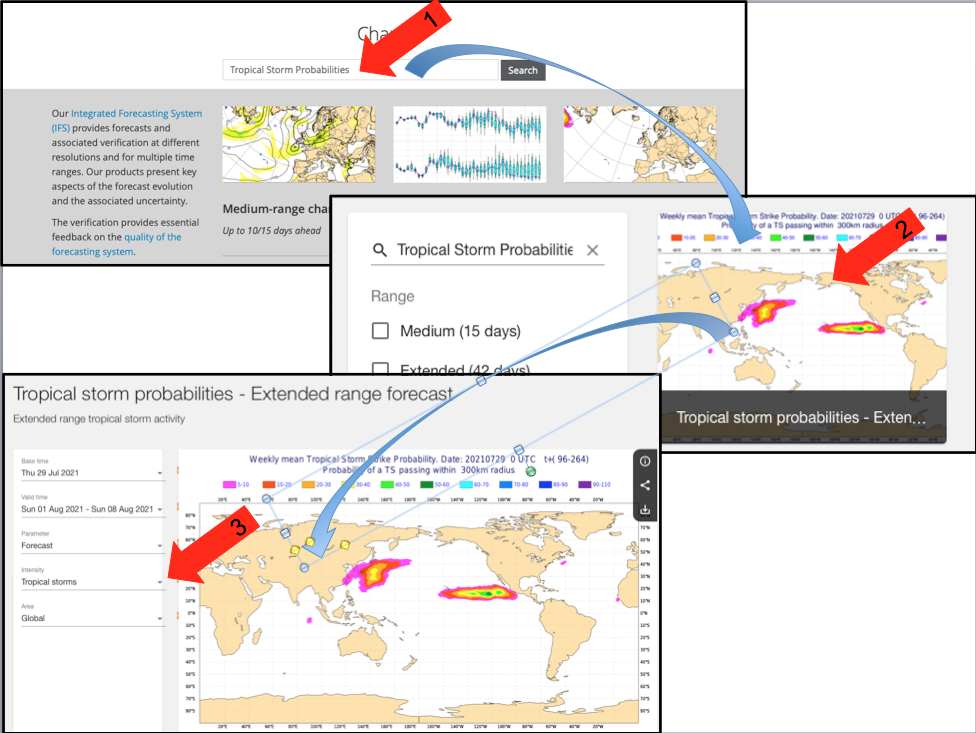
Page: Section 8.2.7 Tropical Storm Output
|
|
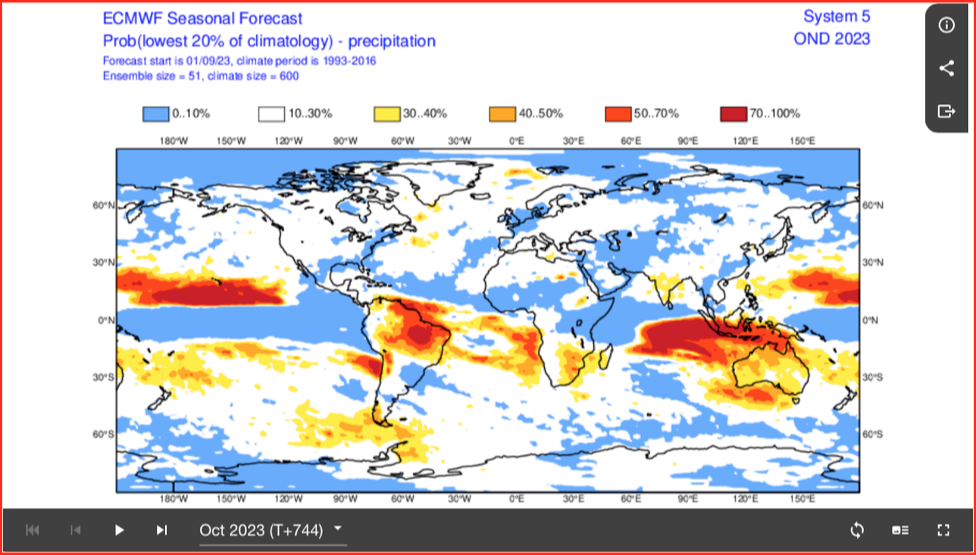
PNG File Screenshot 2023-10-31 at 16.19.20.png |
414 kB |
Bob Owens |
Nov 09, 2023 11:00 |
Nov 09, 2023 11:00 |
|
Page: Section 8.3.1 Chart output
|
|
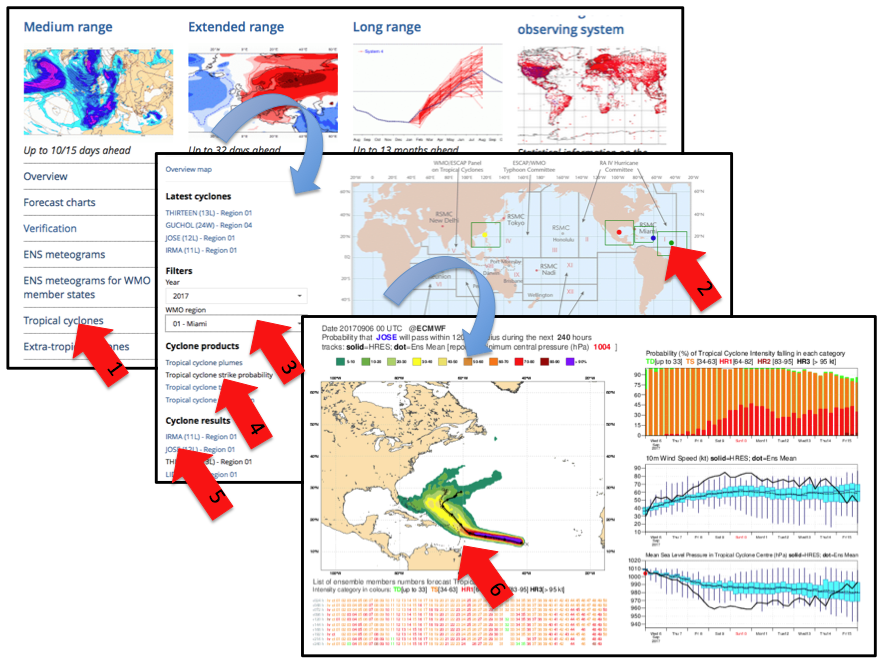
PNG File Screen shot 2017-09-06 at 15.19.39.png |
412 kB |
Bob Owens |
Aug 23, 2022 18:00 |
Aug 23, 2022 18:00 |
|
Page: Section 8.1.16.1 Tropical Cyclone Diagrams - existing TCs
|
|
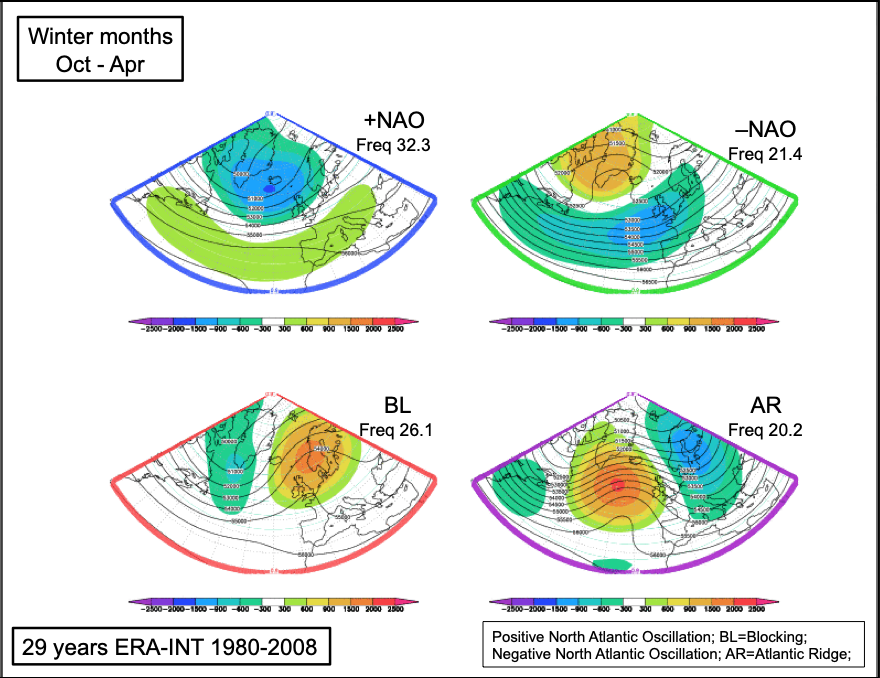
PNG File Winter Type Frequency.png |
410 kB |
Bob Owens |
Aug 23, 2022 17:28 |
Aug 23, 2022 17:28 |
|
Page: Section 8.1.3.1 Clustering - ENS Medium-Range
|
|
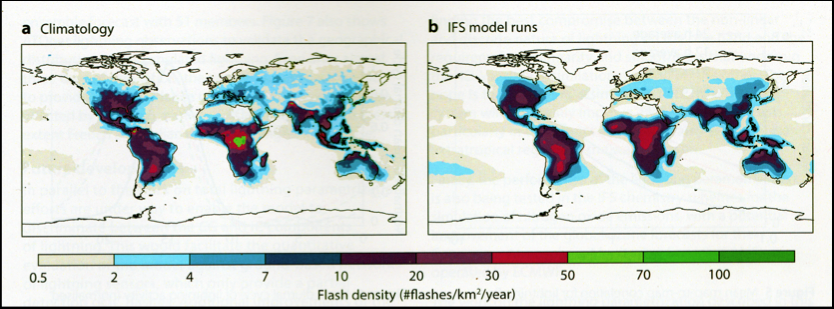
PNG File Fig10.2.18 Lightning.png |
410 kB |
Bob Owens |
Aug 23, 2022 18:08 |
Aug 23, 2022 18:08 |
|
Page: Section 8.1.13 Lightning
|
|
PNG File Fig10.2.18 Lightning.png |
410 kB |
Bob Owens |
May 03, 2023 21:07 |
May 03, 2023 21:07 |
|
Page: Section 8.1.7 Point Rainfall
|
|
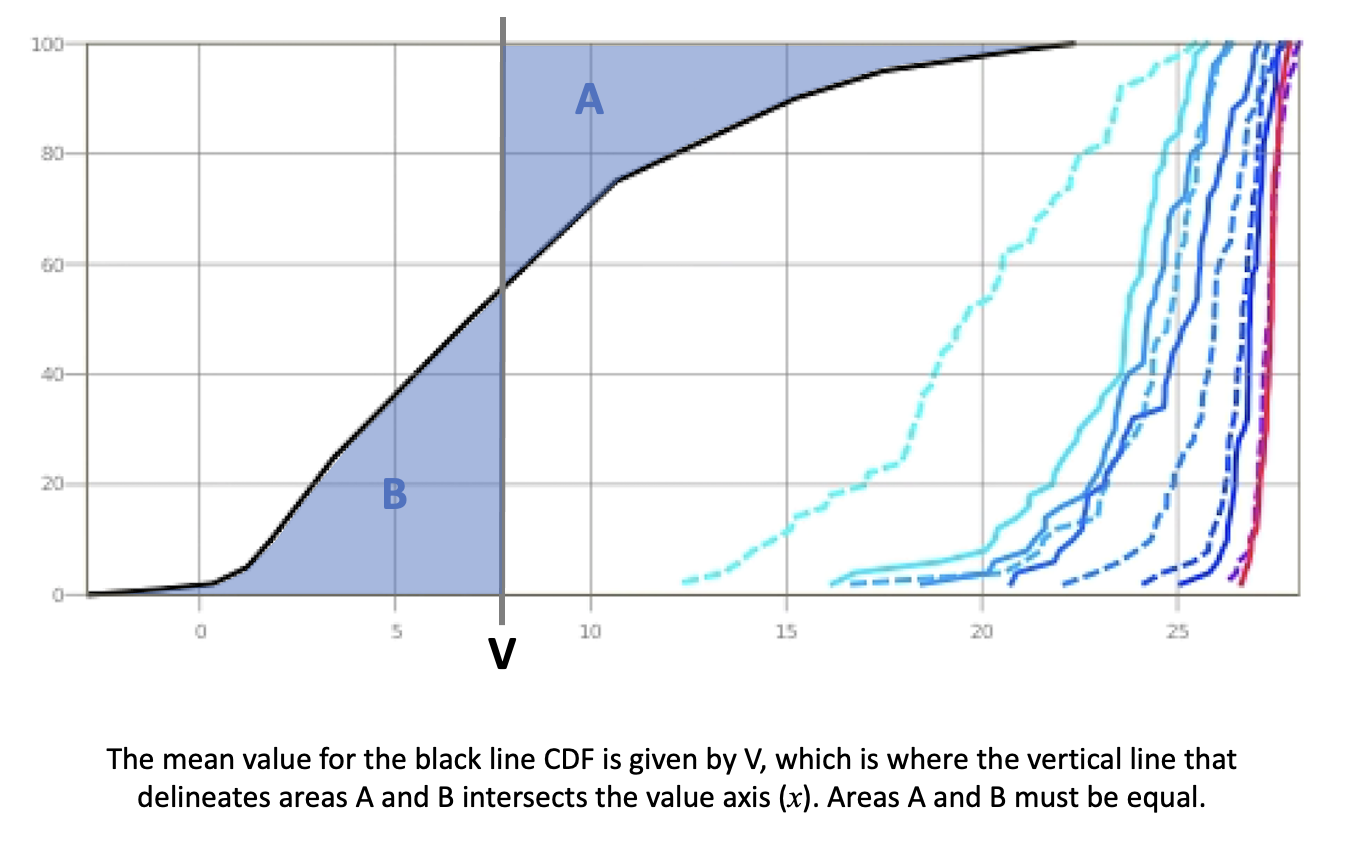
PNG File CDF_mean_calculation_FUG.png |
408 kB |
Bob Owens |
Aug 23, 2022 17:31 |
Aug 23, 2022 17:31 |
|
Page: Section 8.1.9.1 Cumulative Distribution Function, Probability Density Function
|
|
PNG File Screenshot 2023-03-06 at 17.22.18.png |
407 kB |
Bob Owens |
Mar 06, 2023 17:22 |
Mar 06, 2023 17:22 |
|
Page: Section 2.1.4.5 Modelling soil structure
|
|
PNG File Screenshot 2024-01-08 at 17.05.22.png |
403 kB |
Bob Owens |
Mar 14, 2024 12:16 |
Mar 14, 2024 12:16 |
|
Page: Section8.1.10.1 Examples of freezing precipitation - charts and diagrams
|
|
PNG File Screenshot 2024-01-08 at 17.05.22.png |
403 kB |
Bob Owens |
Jan 09, 2024 16:46 |
Jan 09, 2024 16:46 |
|
Page: Section 8.1.10 Types of Precipitation - charts and diagrams
|
|
PNG File Screenshot 2024-02-20 at 15.58.19.png |
403 kB |
Bob Owens |
Feb 20, 2024 16:02 |
Feb 20, 2024 16:02 |
|
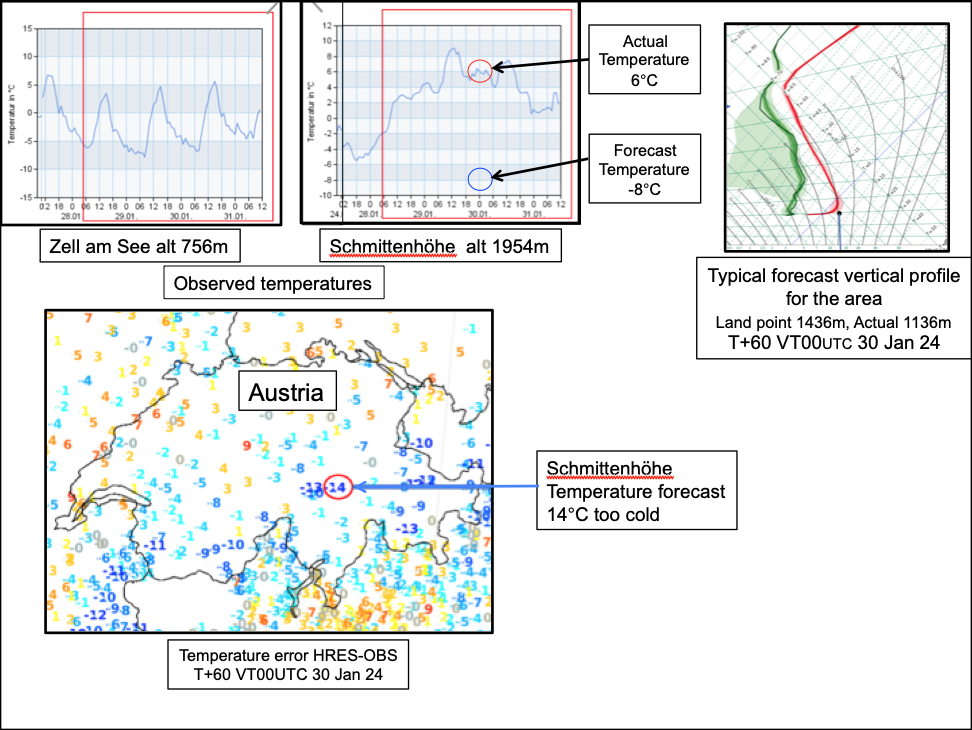
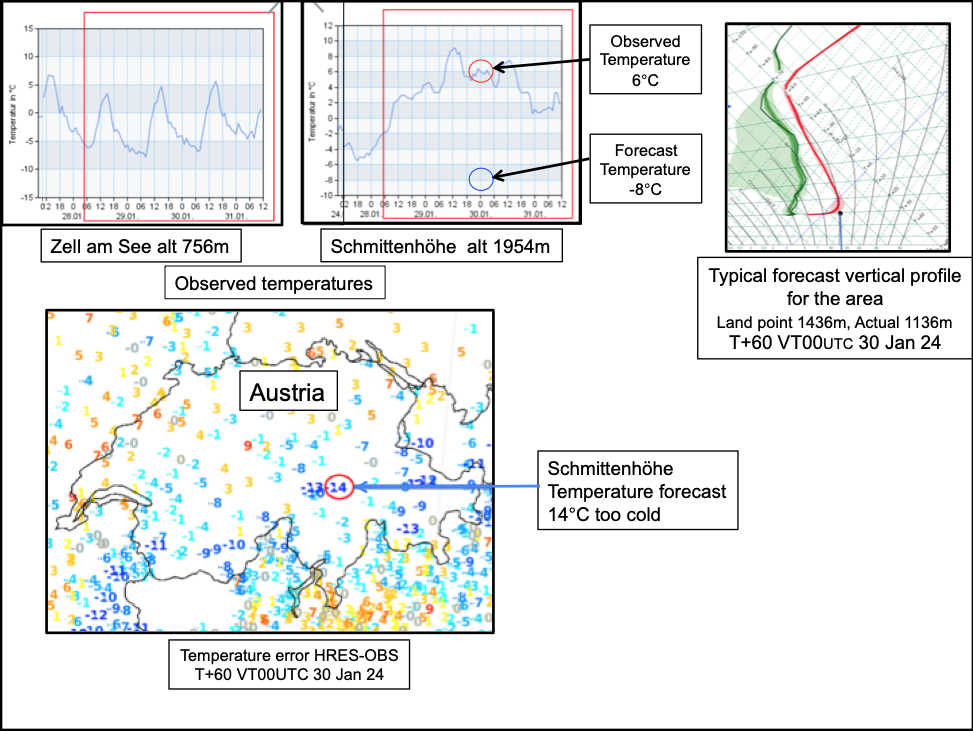
Page: Section 9.2.1 Causes of Errors in Forecast Temperature and Humidity
|
|
PNG File Screenshot 2021-07-30 at 11.29.23.png |
402 kB |
Bob Owens |
Aug 25, 2022 09:55 |
Aug 25, 2022 09:55 |
|
Page: Section 8.2.7 Tropical Storm Output
|
|
PNG File Screenshot 2024-02-26 at 09.49.34.png |
402 kB |
Bob Owens |
Feb 26, 2024 09:50 |
Feb 26, 2024 09:50 |
|
Page: Section 9.2.1 Causes of Errors in Forecast Temperature and Humidity
|
|
PNG File InstabilityIdent BulkWindShear.png |
400 kB |
Bob Owens |
May 08, 2023 12:55 |
May 08, 2023 12:55 |
|
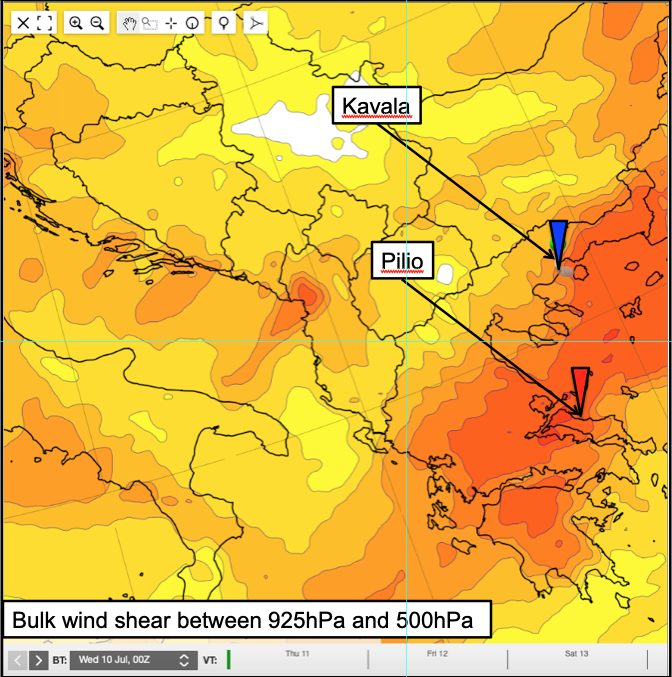
Page: Section 9.6 Convective Precipitation
|
|
PNG File InstabilityIdent BulkWindShear.png |
400 kB |
Bob Owens |
May 08, 2023 13:14 |
May 08, 2023 13:14 |
|
Page: Section 9.6.1 Examples of convection problems
|
|
PNG File InstabilityIdent BulkWindShear.png |
400 kB |
Bob Owens |
Sept 06, 2022 21:10 |
Sept 06, 2022 21:10 |
|
Page: Section 2.1.5.4 Convective Cloud Processes and Precipitation
|