| Name
|
Size
|
Creator |
Creation Date
|
Last Modification Date
|
Labels |
Attached To |
|
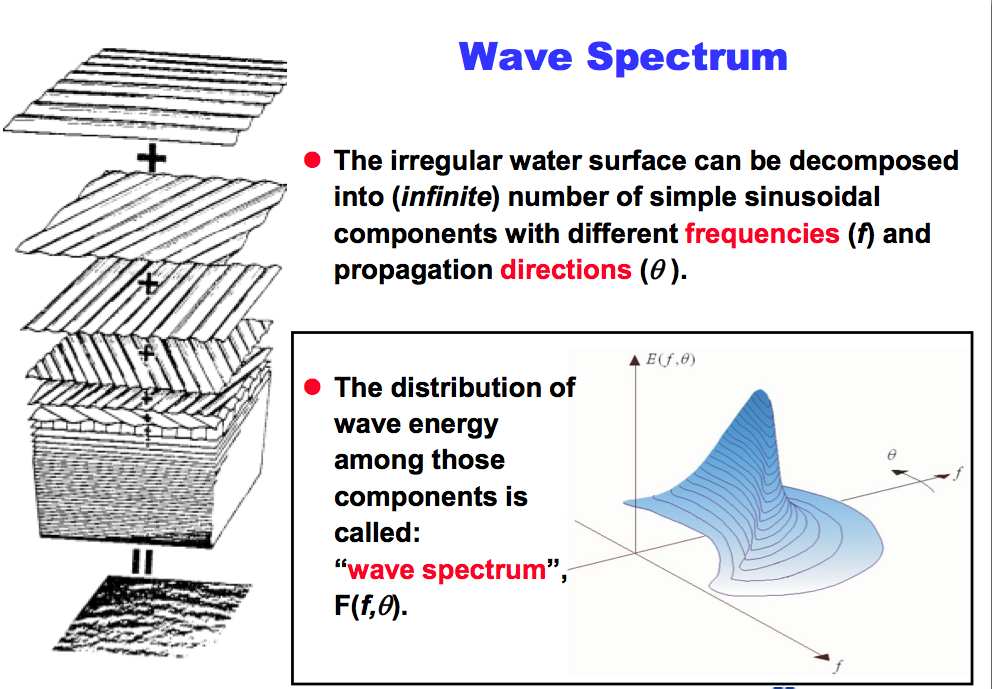
PNG File Fig2.2.2A Decomposition of ocean waves 2D.png |
322 kB |
Bob Owens |
Aug 23, 2022 16:43 |
Aug 23, 2022 16:43 |
|
Page: Section 2.2 Ocean Wave Model - ECWAM
|
|
PNG File Fig2.2.3A Decomposition of ocean waves.png |
322 kB |
Bob Owens |
Aug 23, 2022 16:43 |
Aug 23, 2022 16:43 |
|
Page: Section 2.2 Ocean Wave Model - ECWAM
|
|
PNG File Fig2.2.2A Decomposition of ocean waves 2D.png |
322 kB |
Bob Owens |
Jul 19, 2023 18:01 |
Jul 19, 2023 18:01 |
|
Page: Section 2.2.1 Wave measures and definitions
|
|
PNG File Screenshot 2022-07-13 at 09.26.03.png |
321 kB |
Bob Owens |
Aug 25, 2022 10:11 |
Aug 25, 2022 10:11 |
|
Page: Section 9.4 Visibility
|
|
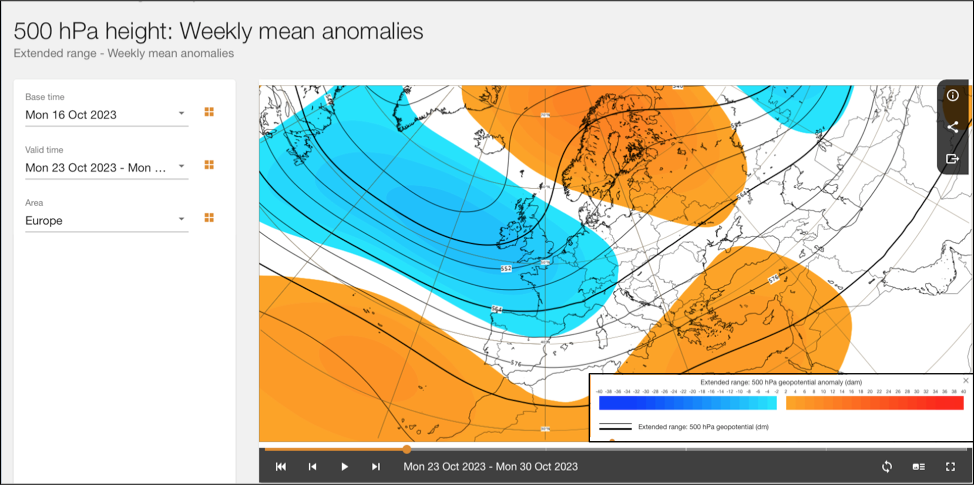
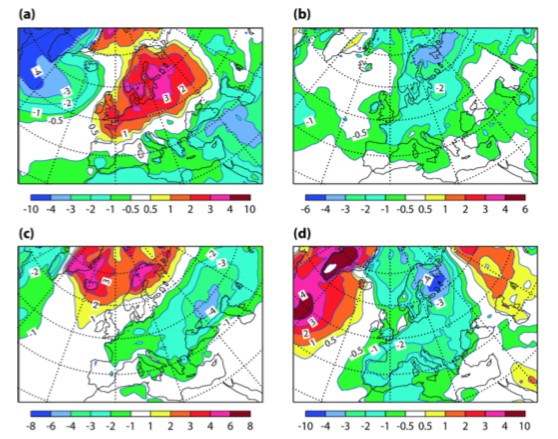
PNG File Screenshot 2023-10-28 at 14.53.42.png |
320 kB |
Bob Owens |
Oct 28, 2023 14:54 |
Oct 28, 2023 14:54 |
|
Page: Section 8.2.2 Circulation patterns or Regimes
|
|
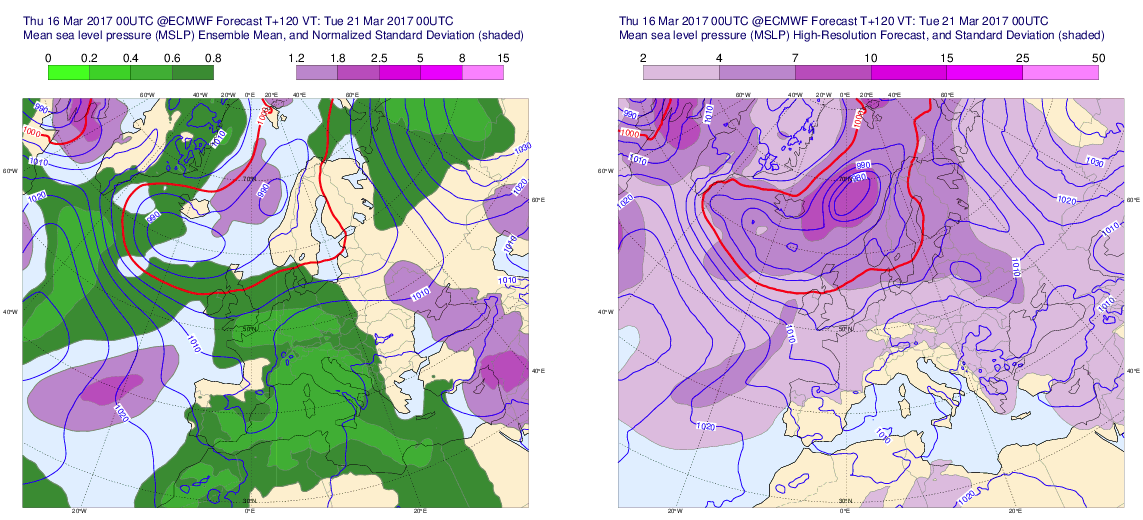
PNG File Fig29E Normalised Mean&Spread.png |
320 kB |
Bob Owens |
Aug 23, 2022 17:26 |
Aug 23, 2022 17:26 |
|
Page: Section 8.1.2 ENS Mean and Spread
|
|
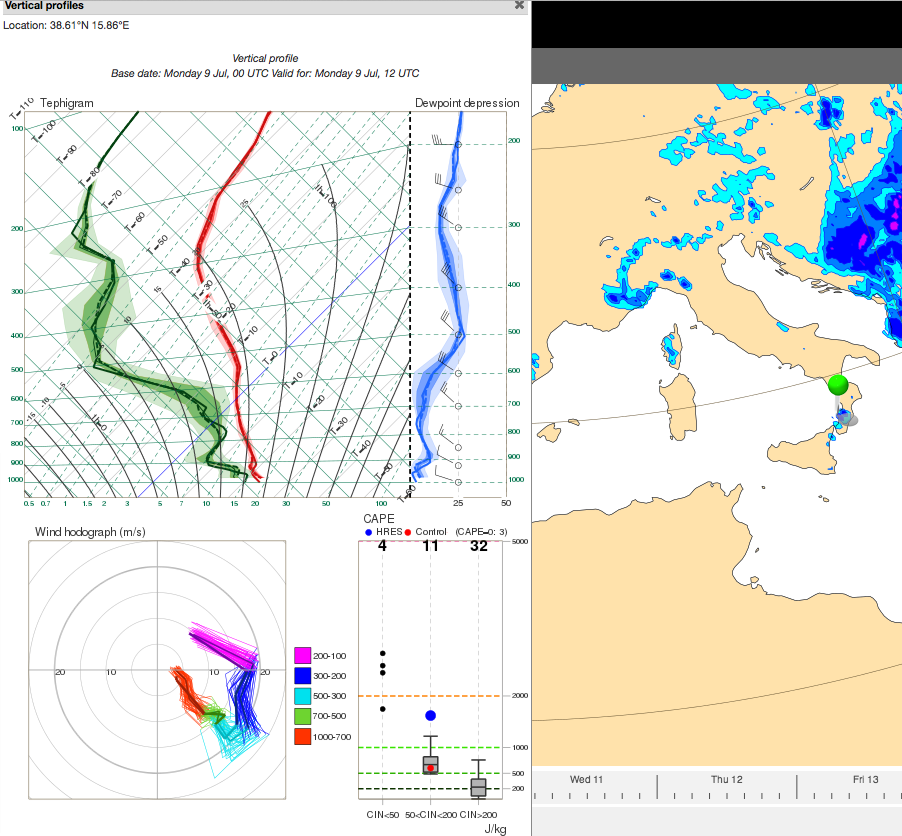
PNG File Fig10.2.5 ItalyBoot OddHighCAPE LowCIN .png |
319 kB |
Bob Owens |
Aug 23, 2022 18:08 |
Aug 23, 2022 18:08 |
|
Page: Section 8.1.8 Vertical Profiles
|
|
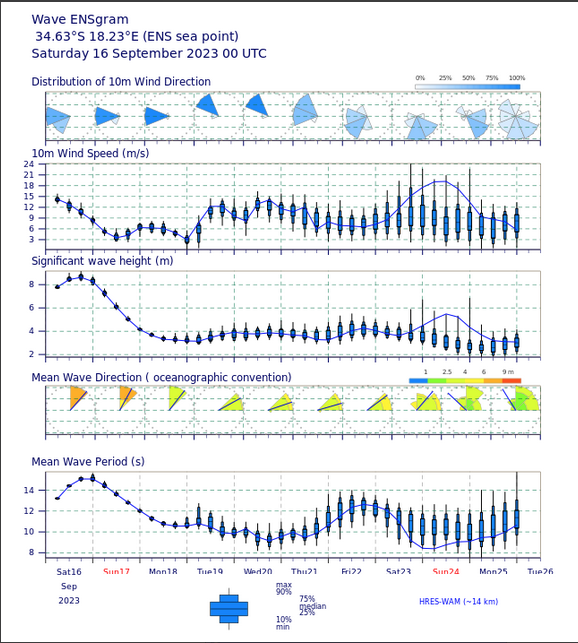
PNG File Screenshot 2023-09-26 at 17.01.32.png |
319 kB |
Bob Owens |
Sept 26, 2023 17:04 |
Sept 26, 2023 17:04 |
|
Page: Section 2.2 Ocean Wave Model - ECWAM
|
|
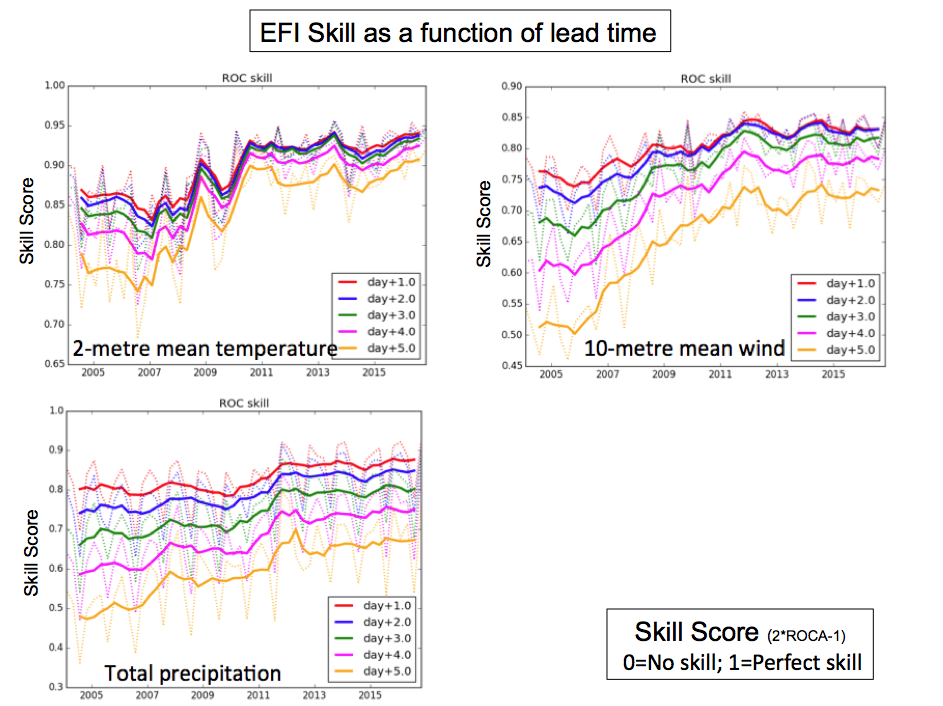
PNG File Fig8.7.7.1 EFI Verification TempWindPpn.png |
318 kB |
Bob Owens |
Aug 23, 2022 17:34 |
Aug 23, 2022 17:34 |
|
Page: Section 8.1.9.8 Verification of EFI
|
|
PNG File Screenshot 2019-03-16 at 16.34.15.png |
317 kB |
Bob Owens |
Aug 25, 2022 09:56 |
Aug 25, 2022 09:56 |
|
Page: Section 8.2.2 Circulation patterns or Regimes
|
|
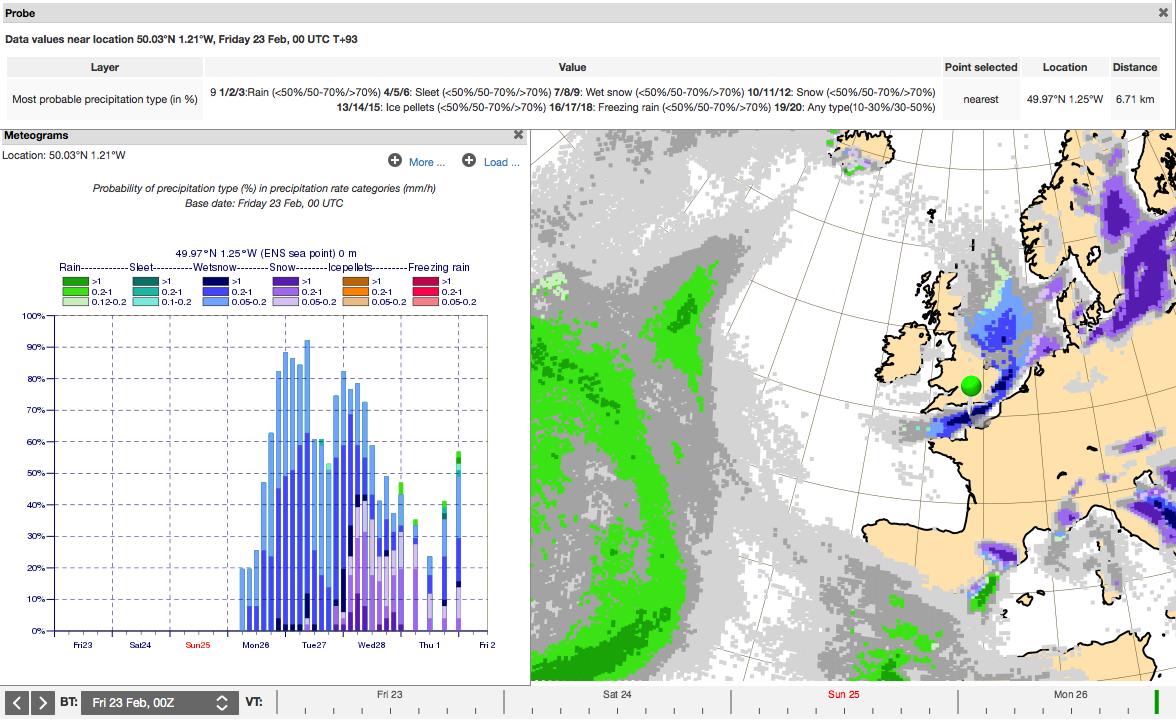
PNG File Fig8.11.40 Type of Precipitation Example.png |
317 kB |
Bob Owens |
Aug 23, 2022 17:55 |
Aug 23, 2022 17:55 |
|
Page: Section 8.1.10 Types of Precipitation - charts and diagrams
|
|
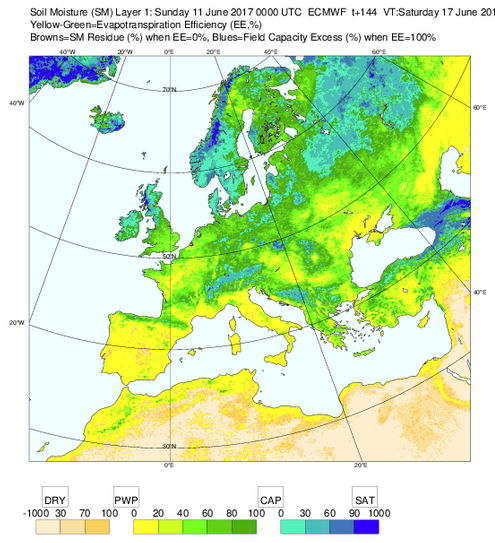
PNG File Fig6.5.3C SoilMoistureCordoba.png |
316 kB |
Bob Owens |
Aug 25, 2022 10:08 |
Aug 25, 2022 10:08 |
|
Page: Section 9.2 Screen Level Temperatures and Moisture
|
|
PNG File Fig6.5.3C SoilMoistureCordoba.png |
316 kB |
Bob Owens |
Aug 25, 2022 10:08 |
Aug 25, 2022 10:08 |
|
Page: Section 9.2.1 Causes of Errors in Forecast Temperature and Humidity
|
|
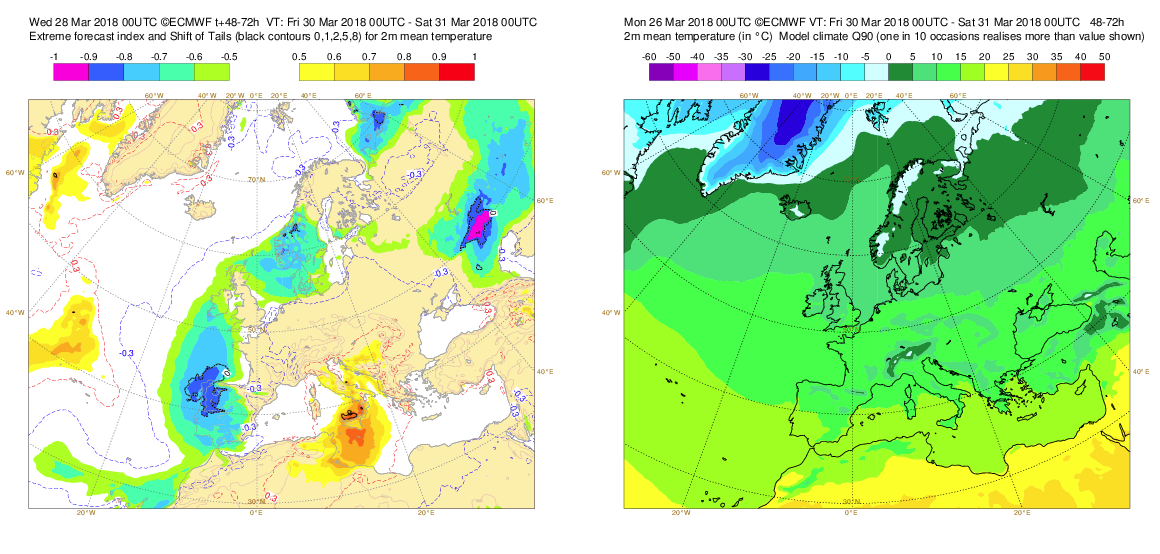
PNG File Fig8.7.4.3 Example EFI SOT charts for M-climate an… |
315 kB |
Bob Owens |
Aug 23, 2022 17:35 |
Aug 23, 2022 17:35 |
|
Page: Section 8.1.9.7 EFI Charts
|
|
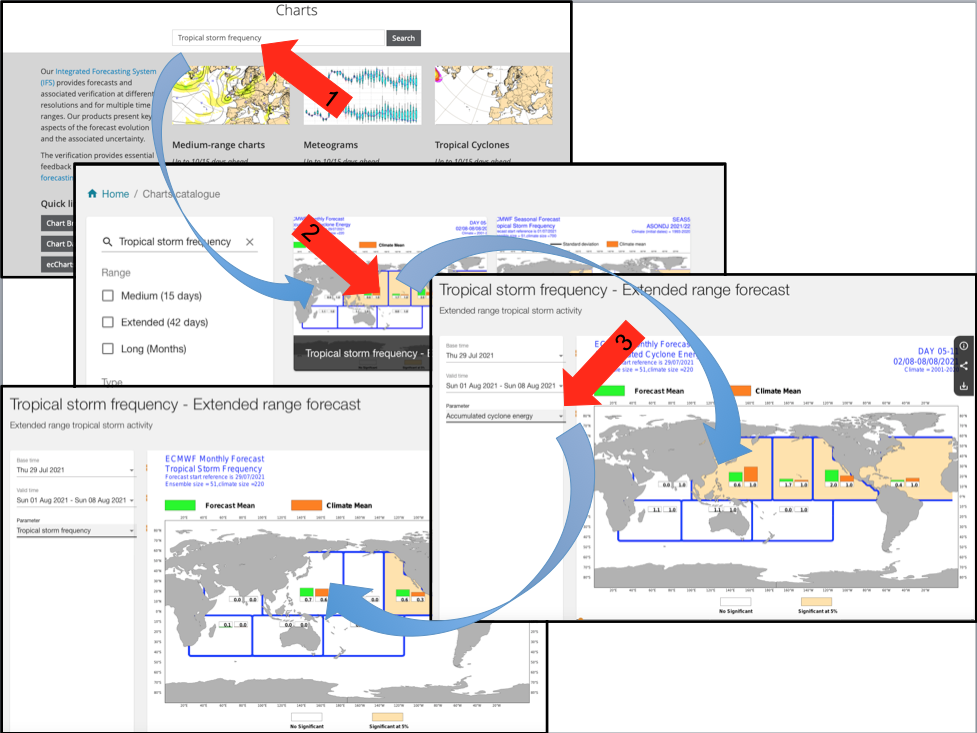
PNG File Screenshot 2021-07-30 at 10.53.25.png |
314 kB |
Bob Owens |
Aug 25, 2022 09:55 |
Aug 25, 2022 09:55 |
|
Page: Section 8.2.7 Tropical Storm Output
|
|
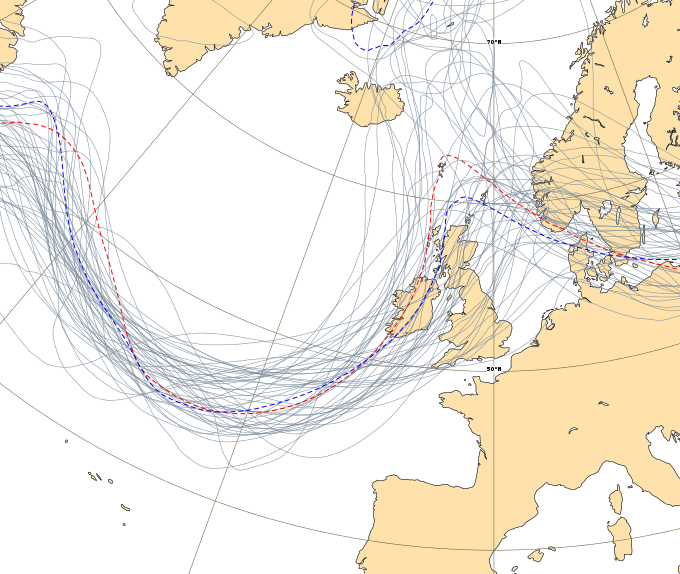
PNG File Fig6.1.4 SpaghettiPlotT+144.png |
314 kB |
Bob Owens |
Aug 23, 2022 17:25 |
Aug 23, 2022 17:25 |
|
Page: Section 8.1.1 Basic ensemble products
|
|
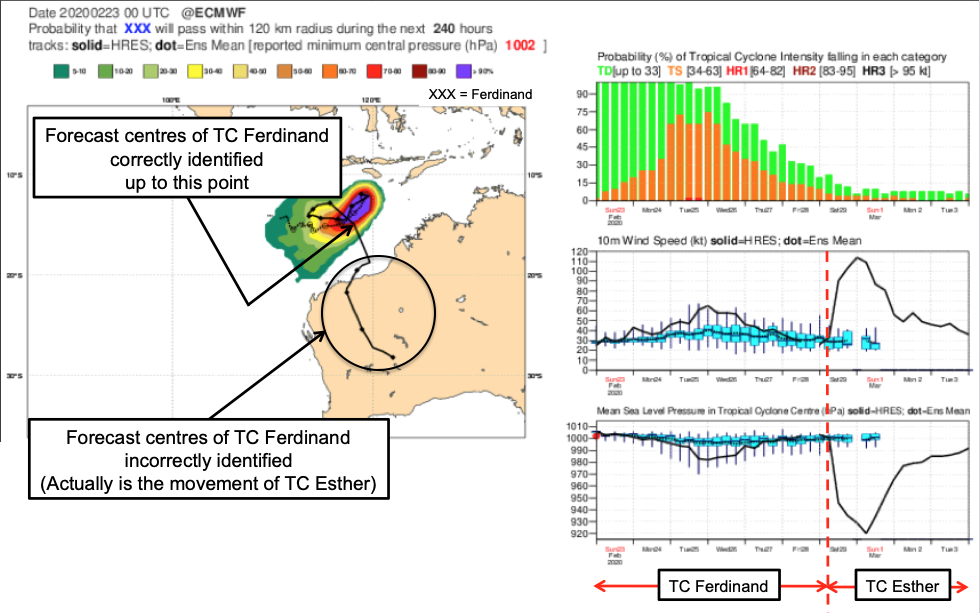
PNG File TC Ferdinand track error.png |
312 kB |
Bob Owens |
Aug 23, 2022 18:00 |
Aug 23, 2022 18:00 |
|
Page: Section 8.1.16.1 Tropical Cyclone Diagrams - existing TCs
|
|
PNG File TC Ferdinand track error.png |
312 kB |
Bob Owens |
Aug 23, 2022 18:02 |
Aug 23, 2022 18:02 |
|
Page: Section 8.1.16.3 Considerations when using Tropical Cyclone products
|
|
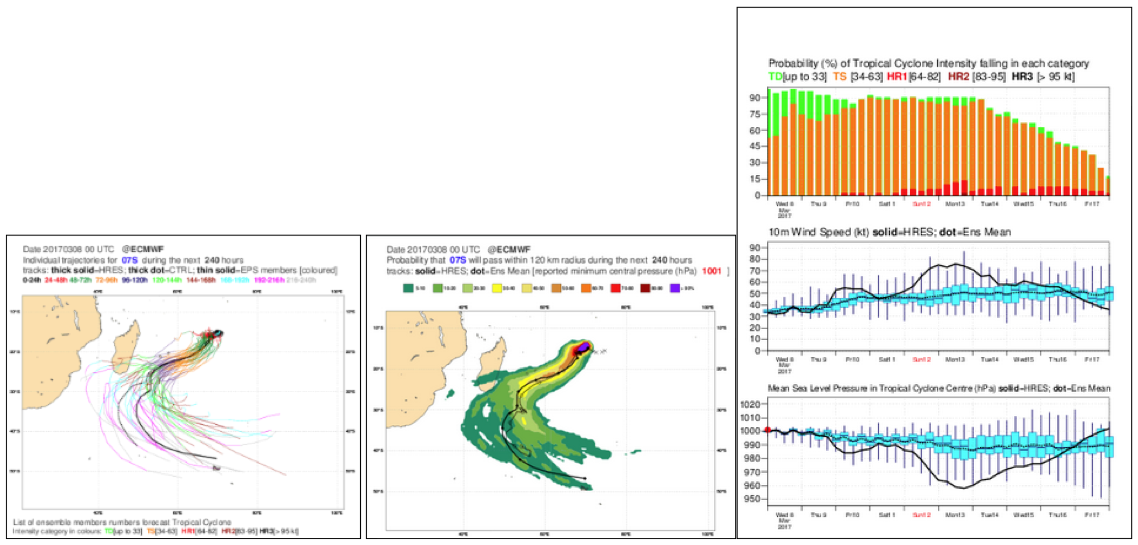
PNG File Fig8.8.1.2A 07S Prob of Strike Traj Hist.png |
310 kB |
Bob Owens |
Aug 23, 2022 18:00 |
Aug 23, 2022 18:00 |
|
Page: Section 8.1.16.1 Tropical Cyclone Diagrams - existing TCs
|
|
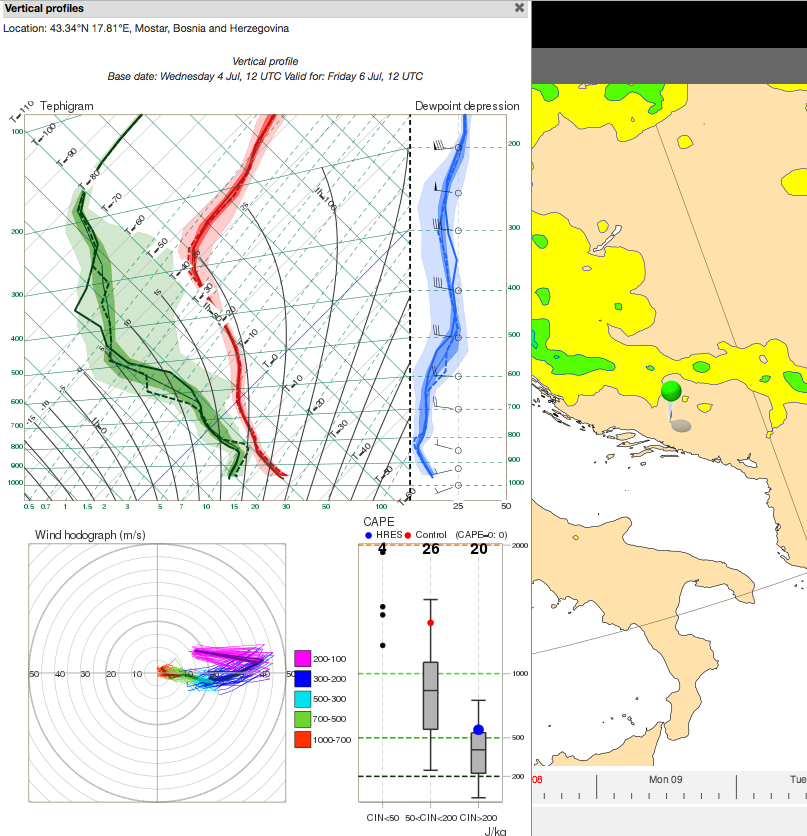
PNG File Fig10.2.6 Mostar OddHighCAPE LowCIN .png |
305 kB |
Bob Owens |
Aug 23, 2022 18:08 |
Aug 23, 2022 18:08 |
|
Page: Section 8.1.8 Vertical Profiles
|