| Name
|
Size
|
Creator |
Creation Date
|
Last Modification Date
|
Labels |
Attached To |
|
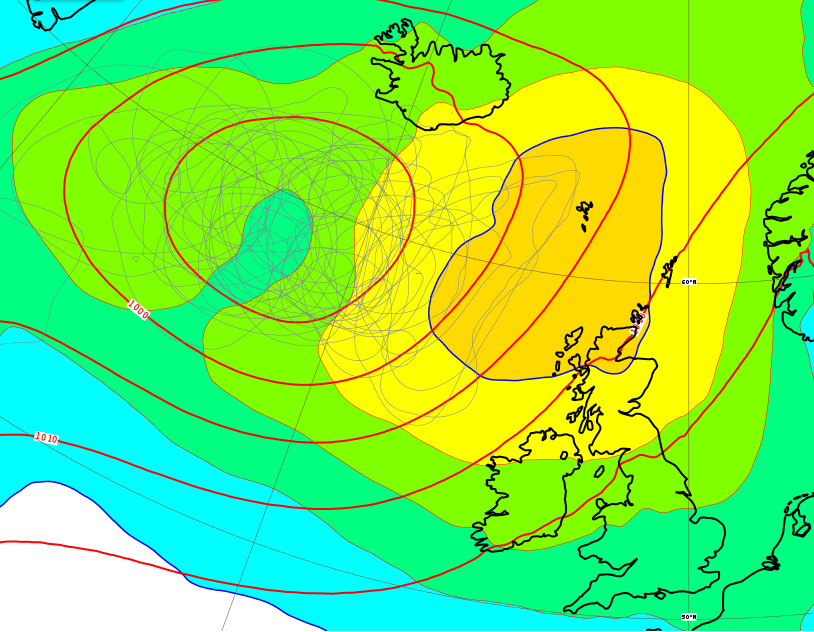
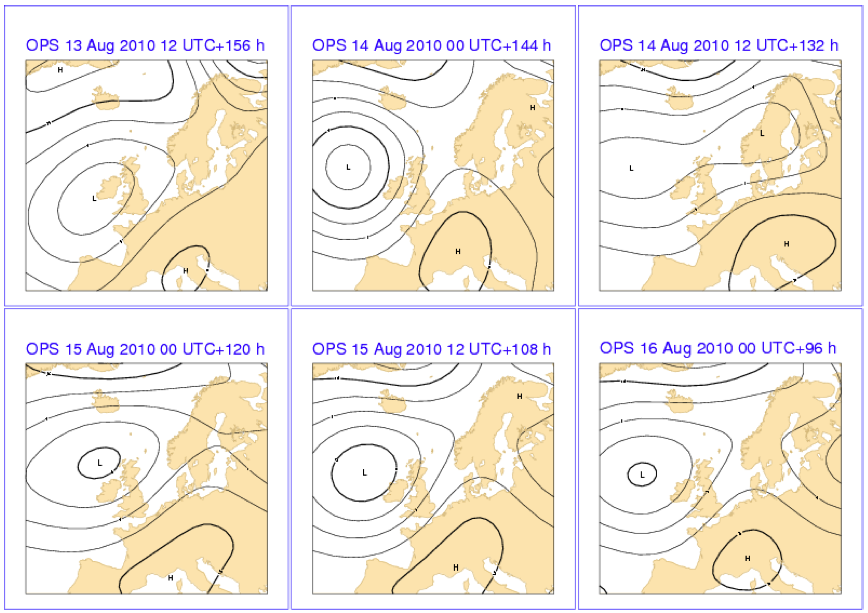
PNG File Fig7.1.6 Low NE Atl Spread 00Z150617.png |
275 kB |
Bob Owens |
Aug 23, 2022 17:25 |
Aug 23, 2022 17:25 |
|
Page: Section 8.1.1 Basic ensemble products
|
|
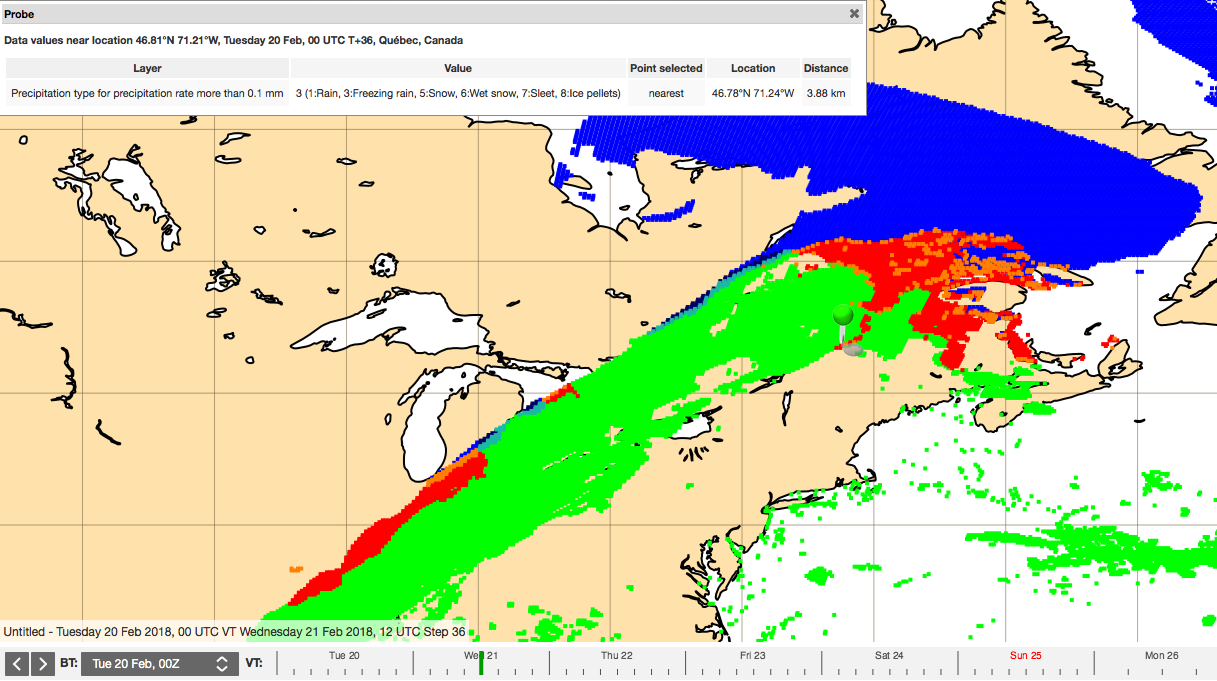
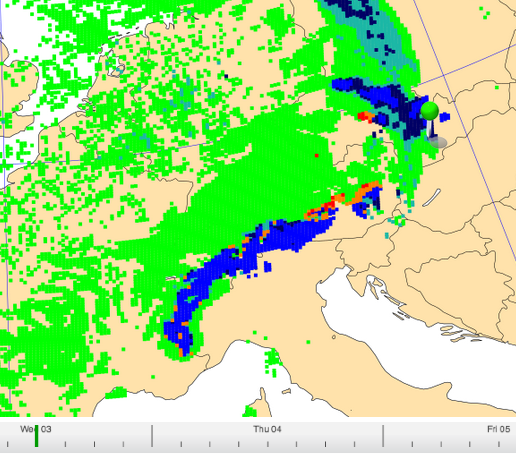
PNG File Fig8.11.18 HRES type of precipitation.png |
275 kB |
Bob Owens |
Aug 23, 2022 17:55 |
Aug 23, 2022 17:55 |
|
Page: Section 8.1.10 Types of Precipitation - charts and diagrams
|
|
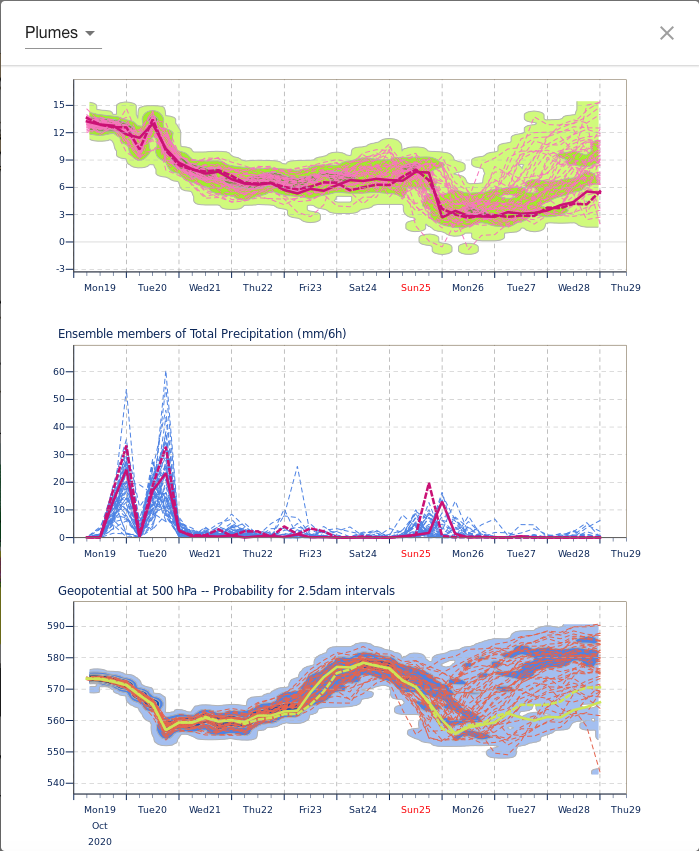
PNG File Screenshot 2020-10-19 at 17.15.55.png |
273 kB |
Bob Owens |
Aug 23, 2022 17:35 |
Aug 23, 2022 17:35 |
|
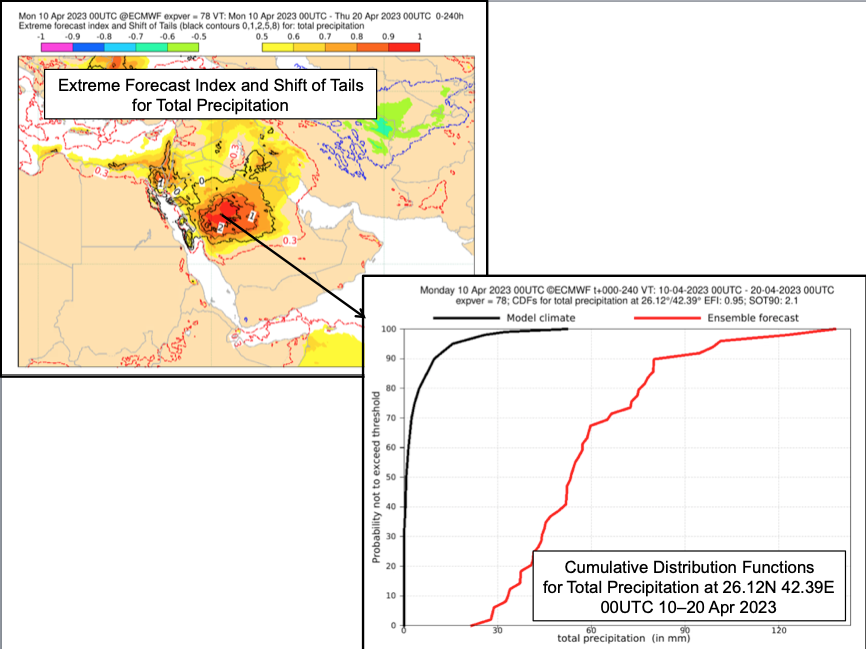
Page: Section 8.1.9.7 EFI Charts
|
|
PNG File Fig7.7.3.6 CapeShearPpn EFI VT 00Z 230617 T+24 DT … |
273 kB |
Bob Owens |
Aug 23, 2022 17:33 |
Aug 23, 2022 17:33 |
|
Page: Section 8.1.9.6 Forecasting Severe Convective Hazards
|
|
PNG File Screenshot 2023-05-08 at 16.24.17.png |
271 kB |
Bob Owens |
May 08, 2023 16:24 |
May 08, 2023 16:24 |
|
Page: Section 6.2.2 Anomaly Correlation Coefficient
|
|
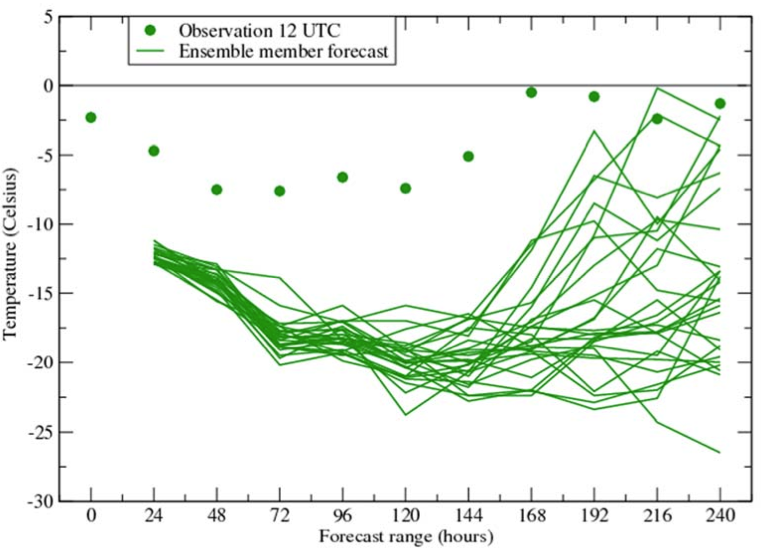
PNG File Fig10.B.17 Plume Diag Fc Temps.png |
268 kB |
Bob Owens |
Jul 06, 2023 09:24 |
Jul 06, 2023 09:24 |
|
Page: Section 12.B Statistical Concepts - Probabilistic Data
|
|
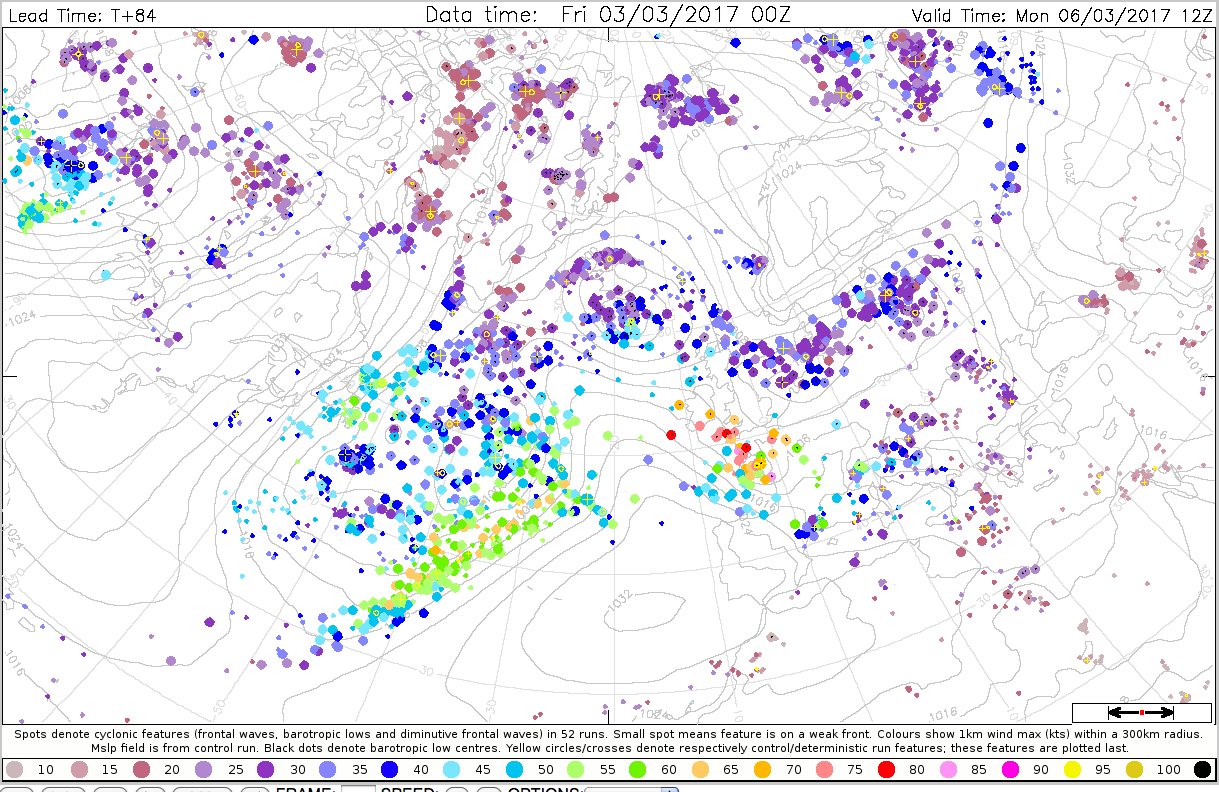
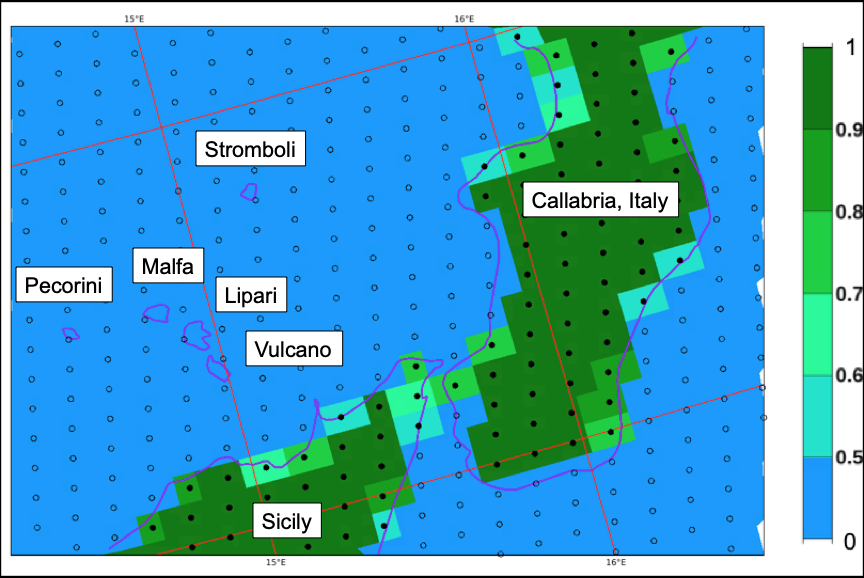
PNG File Fig59j Dalmation Plot 60kt 300km.png |
266 kB |
Bob Owens |
Aug 23, 2022 17:56 |
Aug 23, 2022 17:56 |
|
Page: Section 8.1.15 Extra-tropical Cyclone Diagrams
|
|
PNG File Fig59j Dalmation Plot 60kt 300km.png |
266 kB |
Bob Owens |
Aug 23, 2022 17:57 |
Aug 23, 2022 17:57 |
|
Page: Section 8.1.15.1 New Product Format From 18 May 2021
|
|
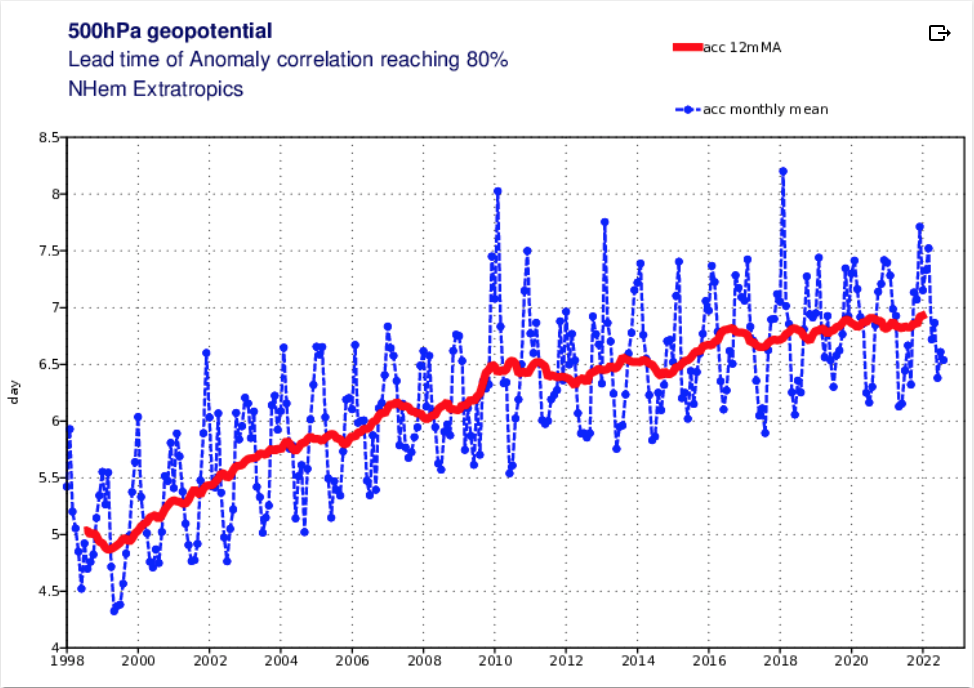
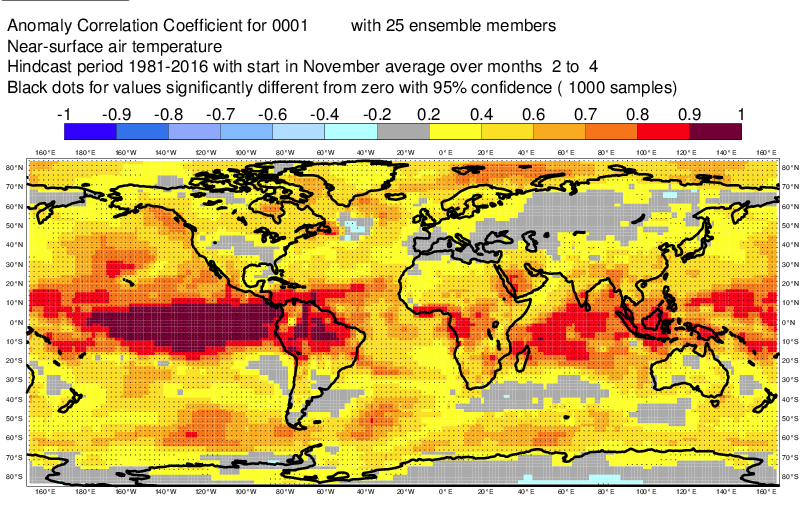
PNG File Fig8.13.14 System5 ACC 2mT Mon2to4 FMA.png |
265 kB |
Bob Owens |
Aug 23, 2022 17:24 |
Aug 23, 2022 17:24 |
|
Page: Section 8.3.5 Using verification metrics with the output
|
|
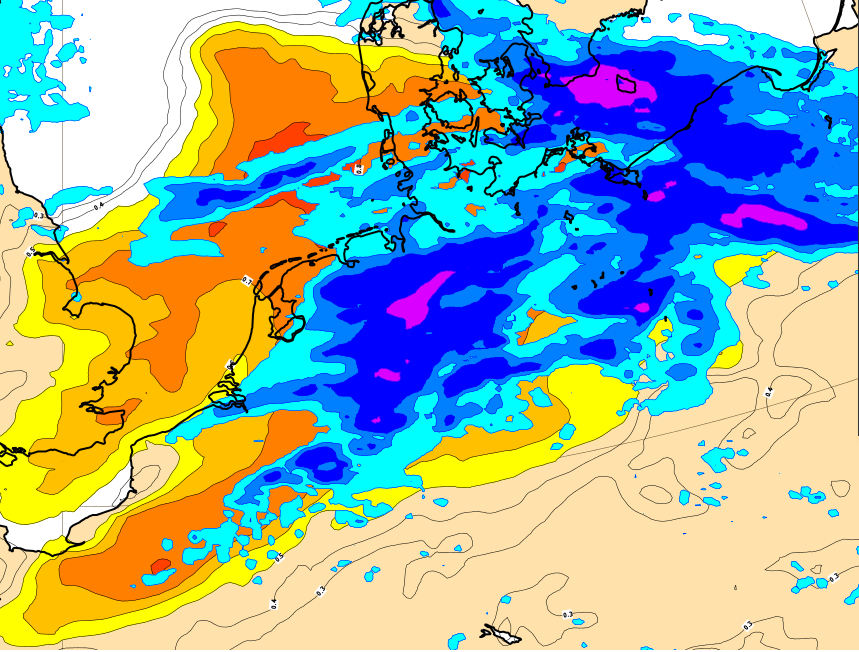
PNG File Screenshot 2023-08-11 at 14.38.03.png |
264 kB |
Bob Owens |
Aug 11, 2023 15:07 |
Aug 11, 2023 15:07 |
|
Page: Section 8.1.9.7 EFI Charts
|
|
PNG File CIN Mao 18Z120820.png |
264 kB |
Bob Owens |
Aug 23, 2022 18:08 |
Aug 23, 2022 18:08 |
|
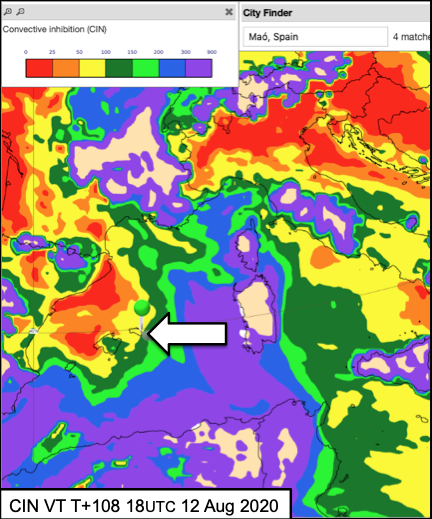
Page: Section 8.1.8 Vertical Profiles
|
|
PNG File Fig10.B.15 Kalman Filtering of Obs.png |
262 kB |
Bob Owens |
Jul 06, 2023 09:24 |
Jul 06, 2023 09:24 |
|
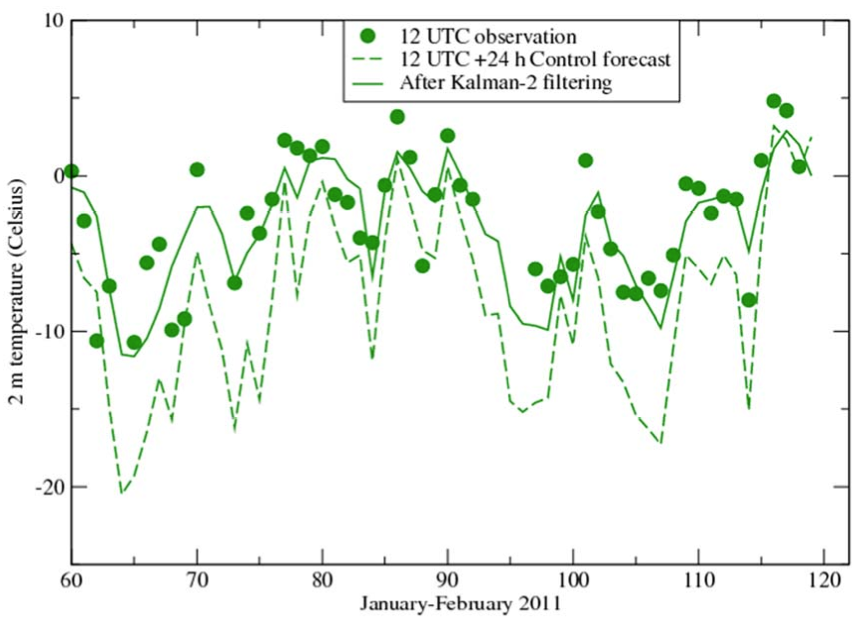
Page: Section 12.B Statistical Concepts - Probabilistic Data
|
|
PNG File Screenshot 2021-02-10 at 11.33.56.png |
261 kB |
Bob Owens |
Aug 23, 2022 16:42 |
Aug 23, 2022 16:42 |
|
Page: Section 2.2 Ocean Wave Model - ECWAM
|
|
PNG File Fig3.3.6 1000mb charts AfterFiltering.png |
261 kB |
Bob Owens |
Aug 23, 2022 16:52 |
Aug 23, 2022 16:52 |
|
Page: Section 4.1 Forecast Error Growth
|
|
PNG File Fig8.11.11 Location of Histogram.png |
261 kB |
Bob Owens |
Aug 23, 2022 17:55 |
Aug 23, 2022 17:55 |
|
Page: Section 8.1.10 Types of Precipitation - charts and diagrams
|
|
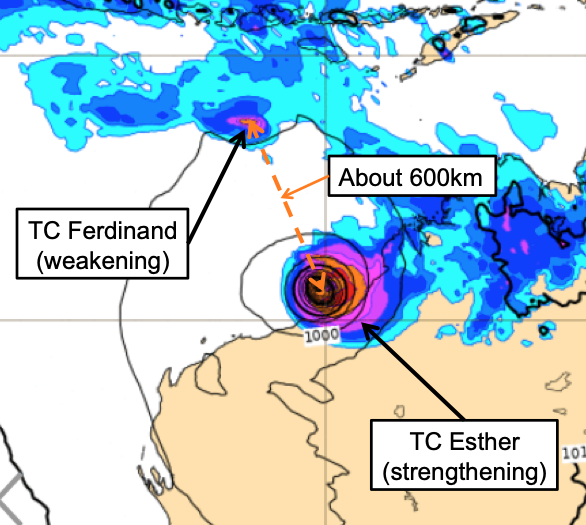
PNG File TCs NE Australia.png |
260 kB |
Bob Owens |
Aug 23, 2022 18:02 |
Aug 23, 2022 18:02 |
|
Page: Section 8.1.16.3 Considerations when using Tropical Cyclone products
|
|
PNG File TCs NE Australia.png |
260 kB |
Bob Owens |
Aug 23, 2022 18:00 |
Aug 23, 2022 18:00 |
|
Page: Section 8.1.16.1 Tropical Cyclone Diagrams - existing TCs
|
|
PNG File Screenshot 2023-06-27 at 16.56.39.png |
259 kB |
Bob Owens |
Jun 27, 2023 16:57 |
Jun 27, 2023 16:57 |
|
Page: Section 8.1.4.1 Selection of grid points for Meteograms
|
|
PNG File Screenshot 2023-06-30 at 22.58.15.png |
259 kB |
Bob Owens |
Jun 30, 2023 22:58 |
Jun 30, 2023 22:58 |
|
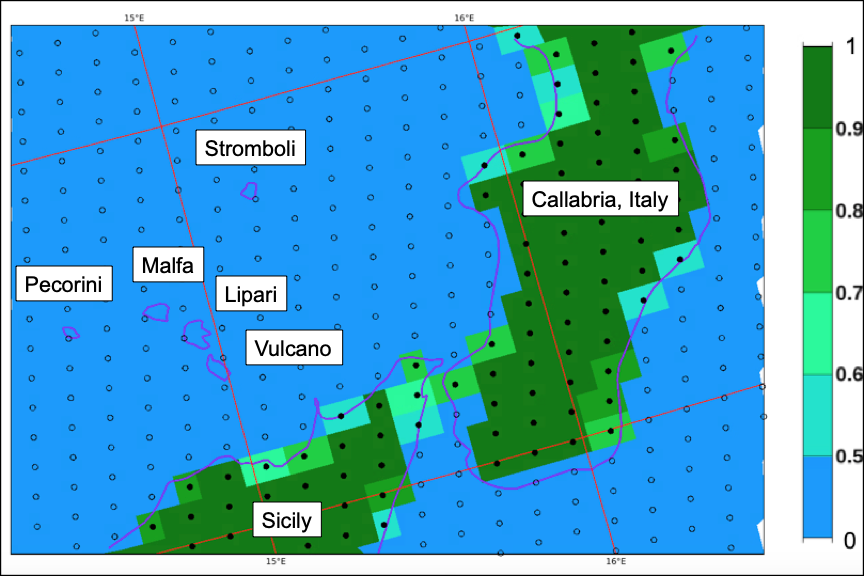
Page: Section 2.1.3.1 Land-Sea Mask
|
|
PNG File Screenshot 2024-06-14 at 17.10.56.png |
259 kB |
Bob Owens |
Jun 14, 2024 16:11 |
Jun 14, 2024 16:11 |
|
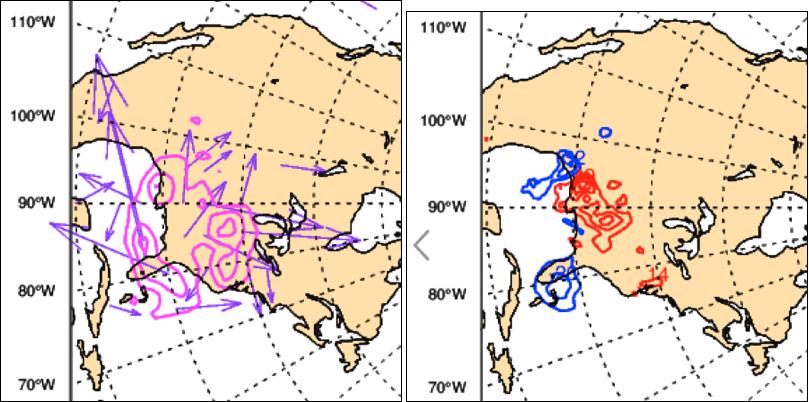
Page: Section 4.2 Analysis Increments
|