| Name
|
Size
|
Creator |
Creation Date
|
Last Modification Date
|
Labels |
Attached To |
|
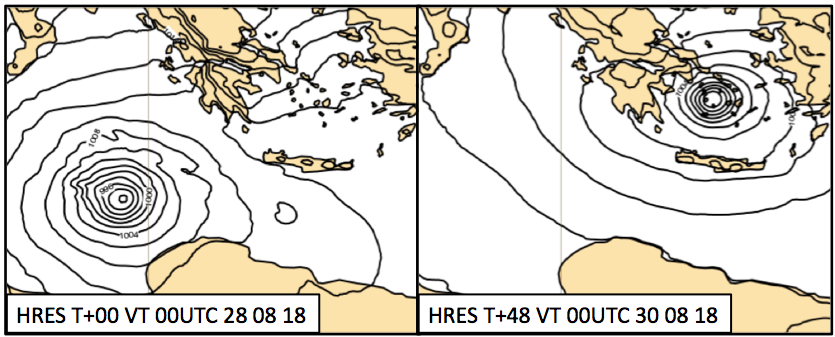
PNG File Fig HRES T+0048 VT 00Z 28300918.png |
210 kB |
Bob Owens |
Aug 23, 2022 17:57 |
Aug 23, 2022 17:57 |
|
Page: Section 8.1.15.1 New Product Format From 18 May 2021
|
|
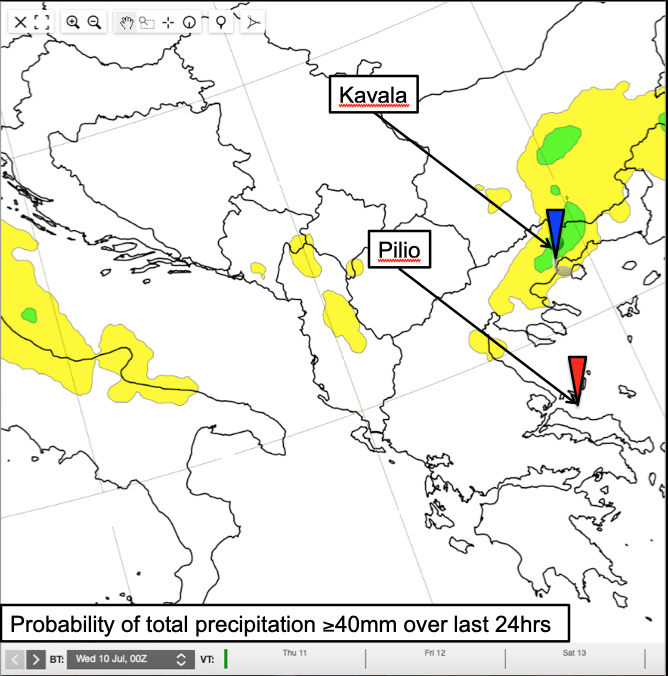
PNG File InstabilityIdent Propb Total Ppn >40mm.png |
209 kB |
Bob Owens |
May 08, 2023 12:55 |
May 08, 2023 12:55 |
|
Page: Section 9.6 Convective Precipitation
|
|
PNG File InstabilityIdent Propb Total Ppn >40mm.png |
209 kB |
Bob Owens |
Sept 06, 2022 21:10 |
Sept 06, 2022 21:10 |
|
Page: Section 2.1.5.4 Convective Cloud Processes and Precipitation
|
|
PNG File InstabilityIdent Propb Total Ppn >40mm.png |
209 kB |
Bob Owens |
May 08, 2023 13:14 |
May 08, 2023 13:14 |
|
Page: Section 9.6.1 Examples of convection problems
|
|
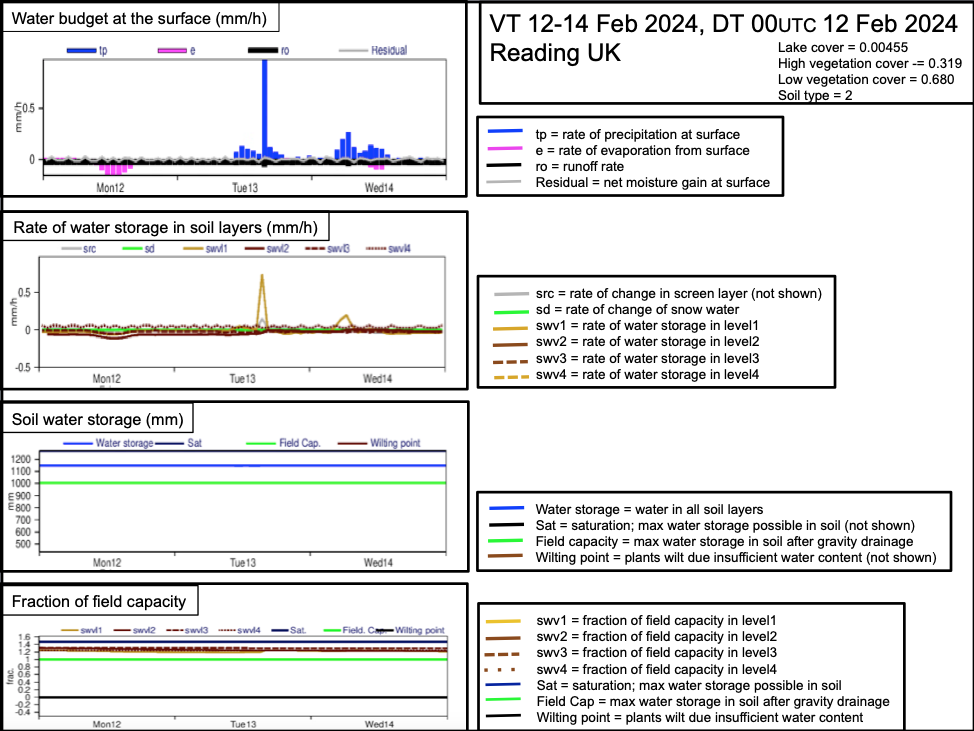
PNG File Screenshot 2024-02-19 at 13.34.19.png |
209 kB |
Bob Owens |
Feb 19, 2024 16:00 |
Feb 19, 2024 16:00 |
|
Page: Section 2.1.4.5 Modelling soil structure
|
|
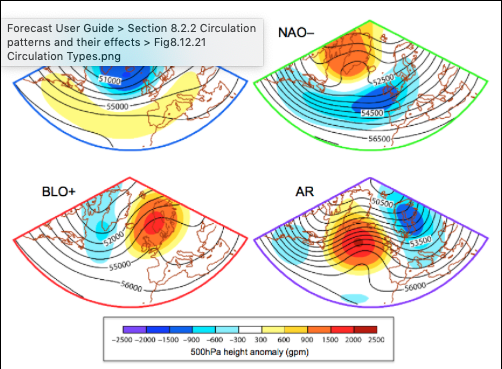
PNG File Screenshot 2023-10-28 at 14.57.24.png |
208 kB |
Bob Owens |
Oct 28, 2023 14:57 |
Oct 28, 2023 14:57 |
|
Page: Section 8.2.2 Circulation patterns or Regimes
|
|
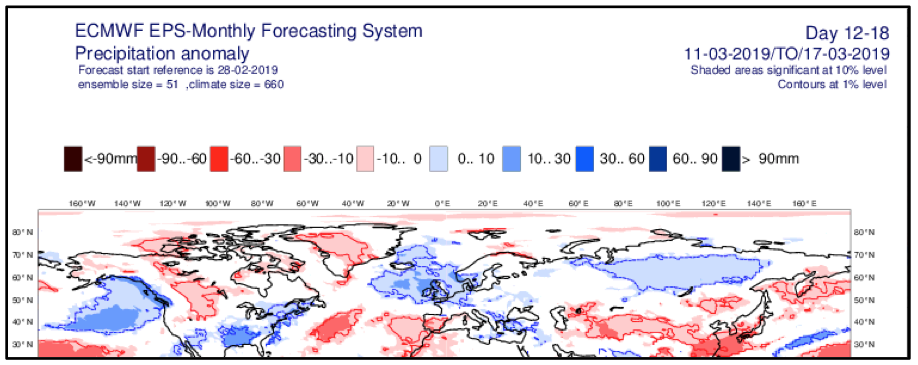
PNG File Screenshot 2019-03-16 at 15.46.27.png |
208 kB |
Bob Owens |
Aug 25, 2022 09:56 |
Aug 25, 2022 09:56 |
|
Page: Section 8.2.2 Circulation patterns or Regimes
|
|
PNG File Screenshot 2019-03-16 at 15.46.27.png |
208 kB |
Bob Owens |
Aug 25, 2022 09:54 |
Aug 25, 2022 09:54 |
|
Page: Section 8.2.6 Madden-Julian Oscillation Output
|
|
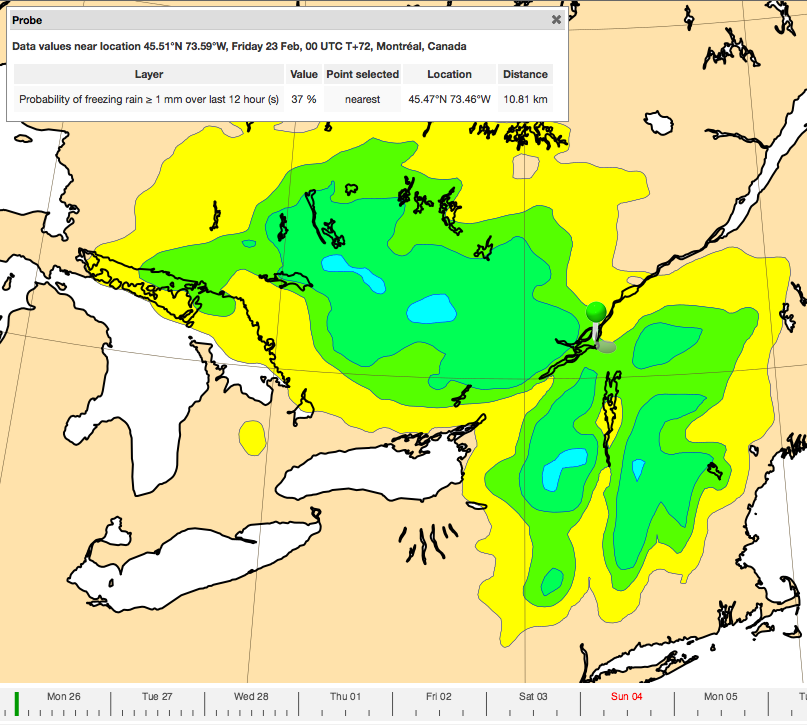
PNG File Fig8.11.38 Prob Freezing Rain.png |
208 kB |
Bob Owens |
Mar 14, 2024 12:16 |
Mar 14, 2024 12:16 |
|
Page: Section8.1.10.1 Examples of freezing precipitation - charts and diagrams
|
|
PNG File Fig8.11.38 Prob Freezing Rain.png |
208 kB |
Bob Owens |
Aug 23, 2022 17:55 |
Aug 23, 2022 17:55 |
|
Page: Section 8.1.10 Types of Precipitation - charts and diagrams
|
|
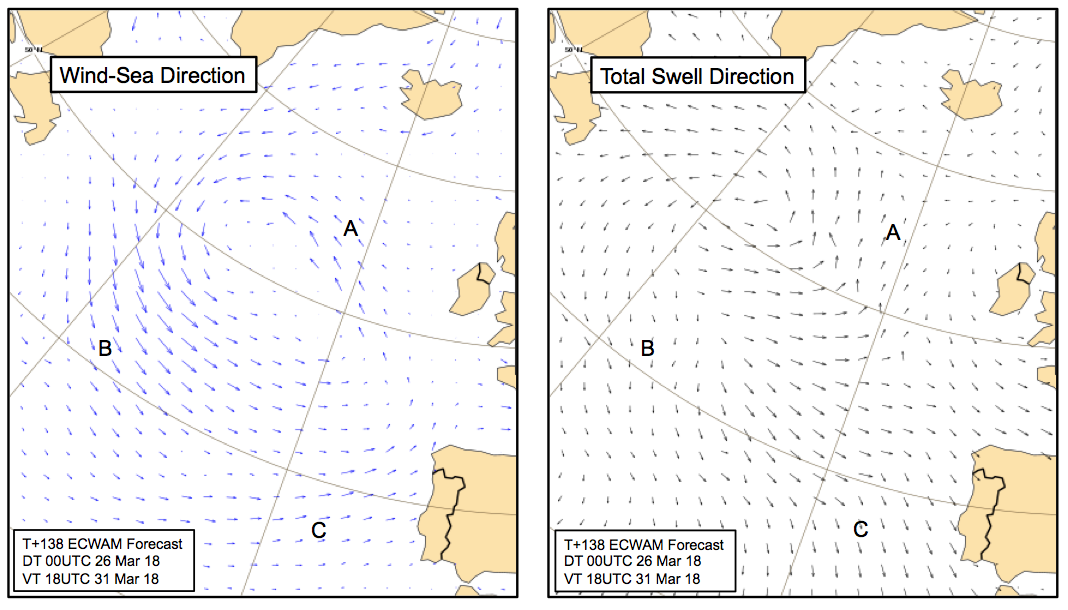
PNG File Fig2.2.10 Wind, Swell.png |
206 kB |
Bob Owens |
Aug 23, 2022 16:42 |
Aug 23, 2022 16:42 |
|
Page: Section 2.2 Ocean Wave Model - ECWAM
|
|
PNG File Fig2.2.11B Wind, Swell.png |
206 kB |
Bob Owens |
Aug 23, 2022 16:43 |
Aug 23, 2022 16:43 |
|
Page: Section 2.2 Ocean Wave Model - ECWAM
|
|
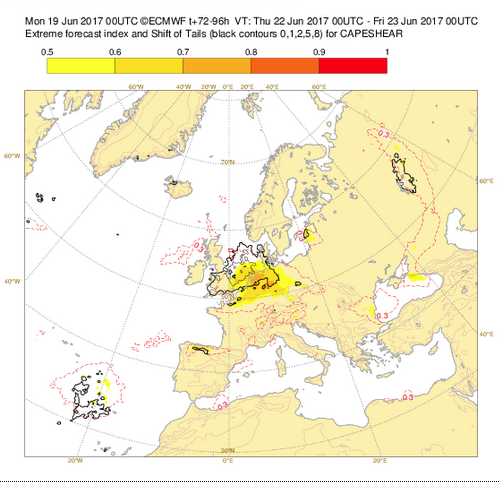
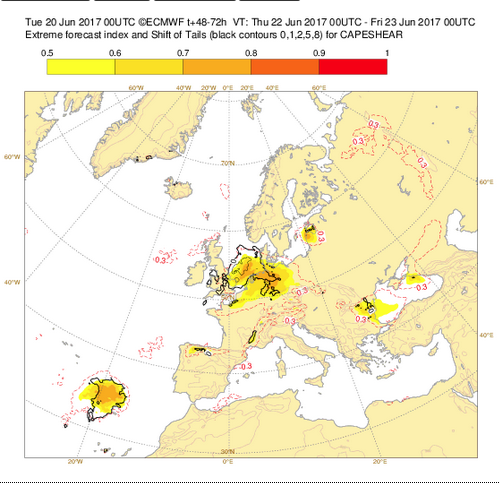
PNG File Fig7.7.3.7 EFI CAPEShere T+96 DT00Z 220617.png |
206 kB |
Bob Owens |
Aug 23, 2022 17:33 |
Aug 23, 2022 17:33 |
|
Page: Section 8.1.9.6 Forecasting Severe Convective Hazards
|
|
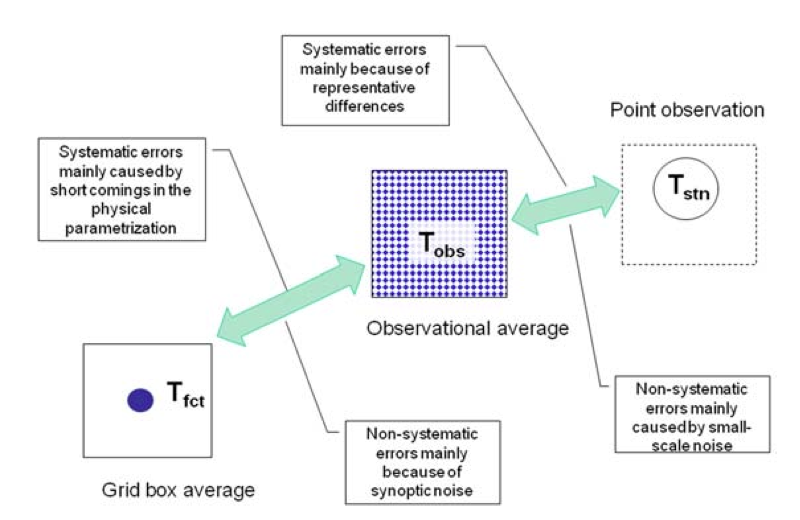
PNG File Fig3.2.1 Sytematic:Nonsystematic Errors1.png |
206 kB |
Bob Owens |
Aug 23, 2022 16:49 |
Aug 23, 2022 16:49 |
|
Page: Section 3.2 Grid Point Values and Observations
|
|
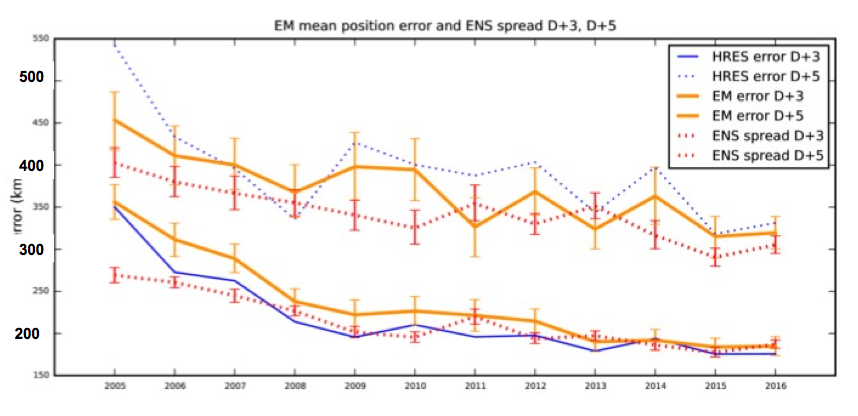
PNG File Fig8.8.3.11 ENS Spread & EM error.png |
206 kB |
Bob Owens |
Aug 23, 2022 18:02 |
Aug 23, 2022 18:02 |
|
Page: Section 8.1.16.3 Considerations when using Tropical Cyclone products
|
|
PNG File Fig7.7.3.7 EFI CAPEShere T+72 DT00Z 220617.png |
205 kB |
Bob Owens |
Aug 23, 2022 17:33 |
Aug 23, 2022 17:33 |
|
Page: Section 8.1.9.6 Forecasting Severe Convective Hazards
|
|
JPEG File ThinkstockPhotos-475166996-new.jpg |
205 kB |
Bob Owens |
Aug 23, 2022 17:15 |
Aug 23, 2022 17:15 |
|
Page: Section 7 ENS Products - Dealing with Uncertainty
|
|
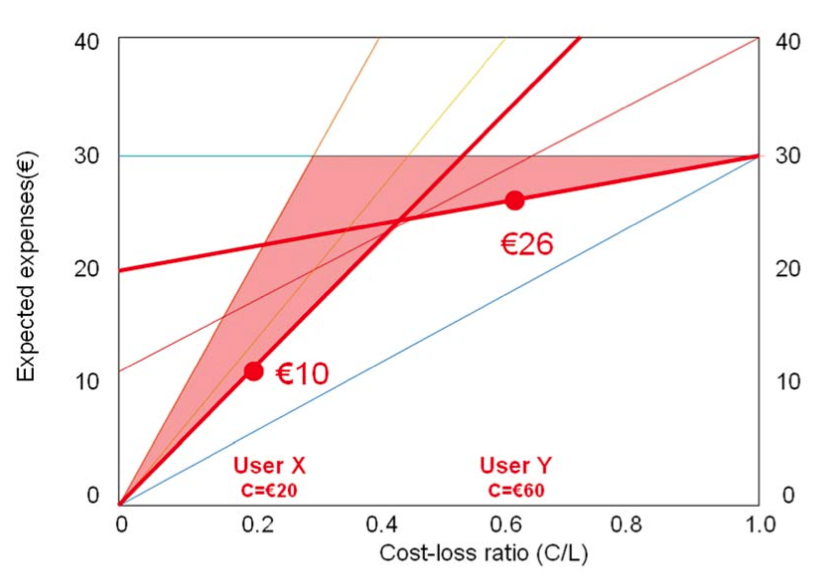
PNG File Fig10.A.20 Cost:Loss Example4.png |
204 kB |
Bob Owens |
Jul 06, 2023 09:22 |
Jul 06, 2023 09:22 |
|
Page: Section 12.A Statistical Concepts - Deterministic Data
|
|
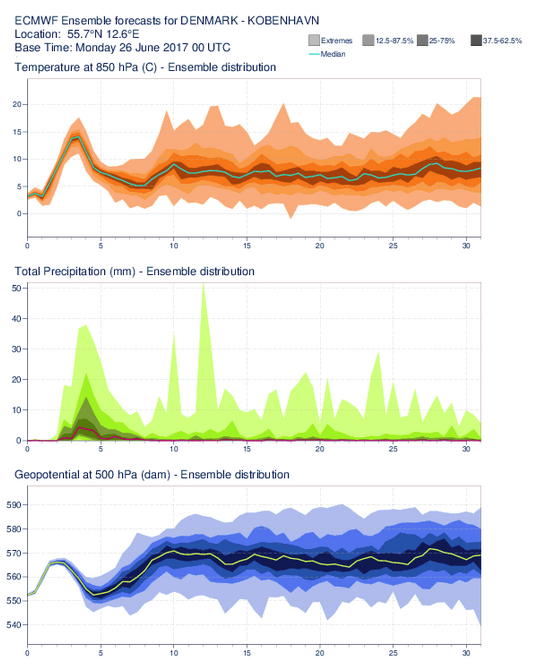
PNG File Fig8.12.1 Monthly Forecast Plume.png |
204 kB |
Bob Owens |
Aug 25, 2022 09:56 |
Aug 25, 2022 09:56 |
|
Page: Section 8.2.1 General use of extended-range output
|
|
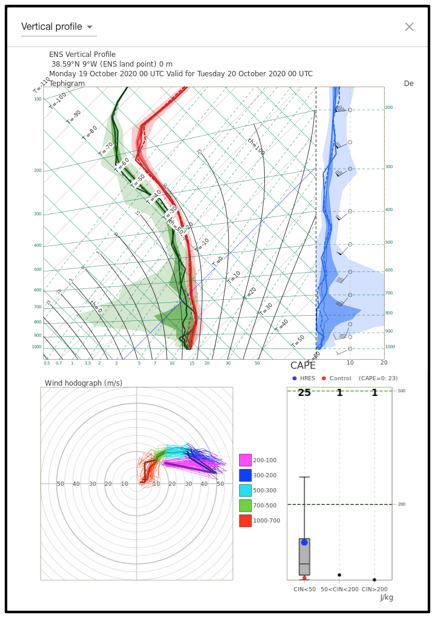
PNG File Screenshot 2020-10-19 at 17.24.50.png |
203 kB |
Bob Owens |
Aug 23, 2022 17:35 |
Aug 23, 2022 17:35 |
|
Page: Section 8.1.9.7 EFI Charts
|