| Name
|
Size
|
Creator |
Creation Date
|
Last Modification Date
|
Labels |
Attached To |
|
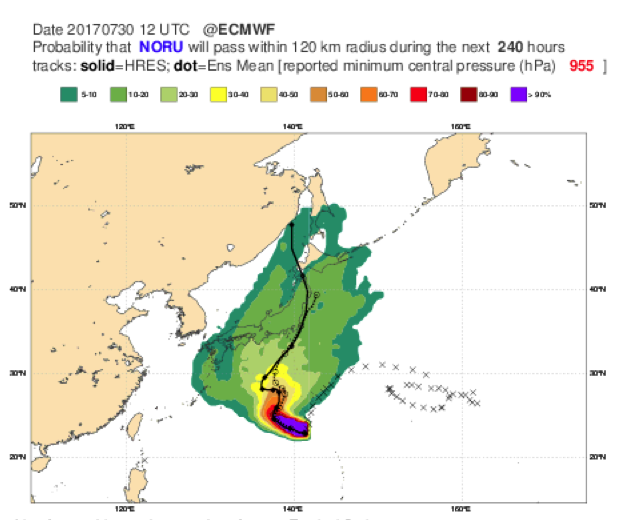
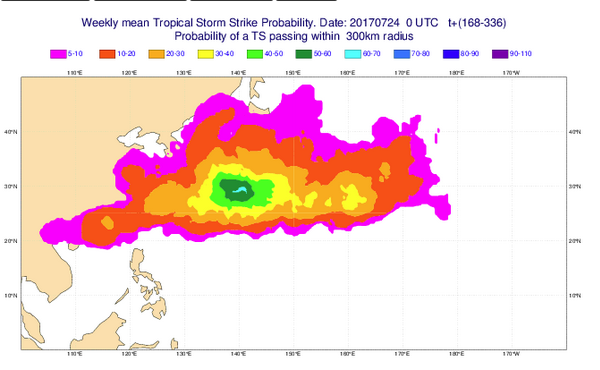
PNG File Fig8.8.2.7 NORU TC Track Probs 300717.png |
114 kB |
Bob Owens |
Aug 23, 2022 18:02 |
Aug 23, 2022 18:02 |
|
Page: Section 8.1.16.3 Considerations when using Tropical Cyclone products
|
|
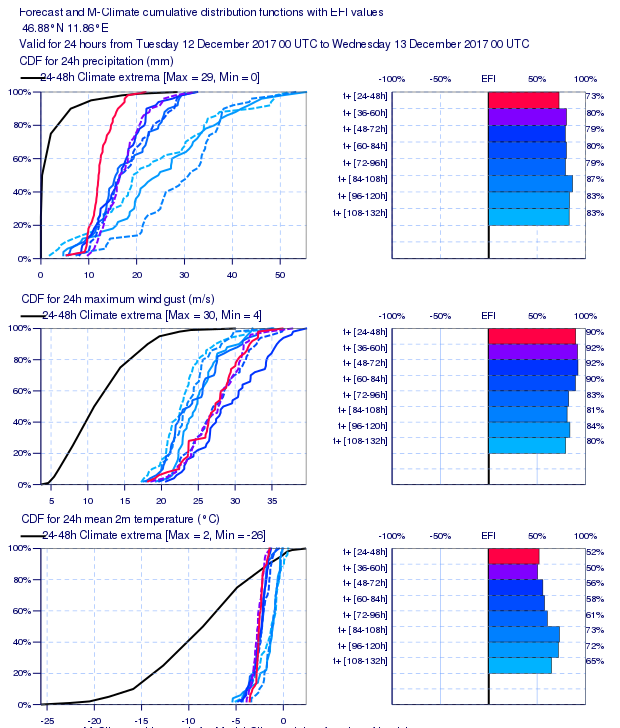
PNG File Fig9.6.8 TSRA CDF Tyrol VT00Z 131217 T+24to48 DT00… |
113 kB |
Bob Owens |
Aug 25, 2022 10:12 |
Aug 25, 2022 10:12 |
|
Page: Section 9.6 Convective Precipitation
|
|
PNG File Fig9.6.8 TSRA CDF Tyrol VT00Z 131217 T+24to48 DT00… |
113 kB |
Bob Owens |
May 08, 2023 13:14 |
May 08, 2023 13:14 |
|
Page: Section 9.6.1 Examples of convection problems
|
|
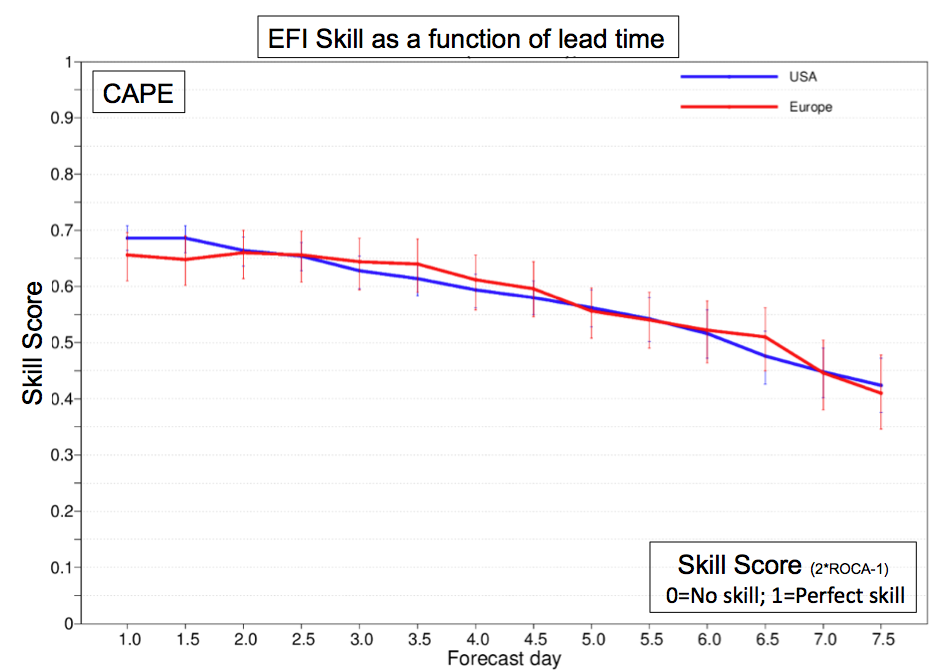
PNG File Fig8.7.7.1 EFI Verification CAPE.png |
113 kB |
Bob Owens |
Aug 23, 2022 17:34 |
Aug 23, 2022 17:34 |
|
Page: Section 8.1.9.8 Verification of EFI
|
|
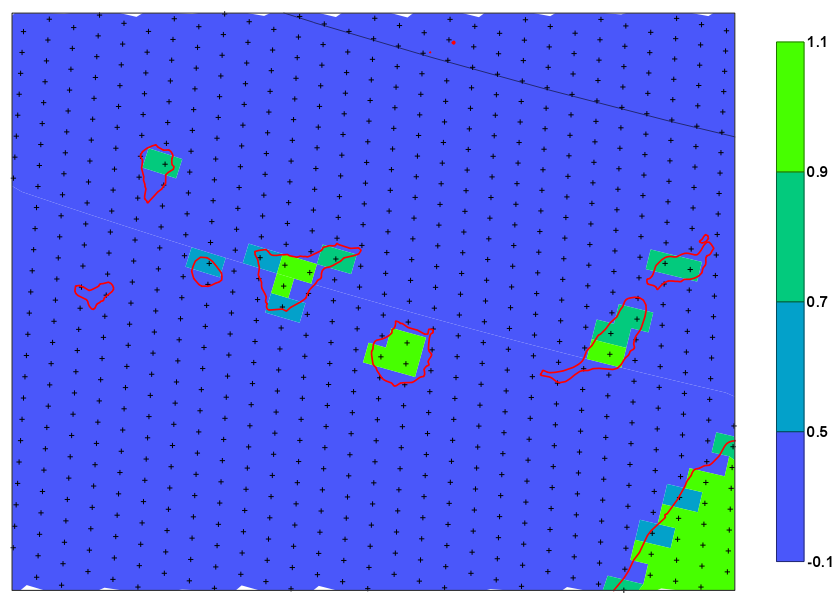
PNG File GRIDENSCanaries.png |
113 kB |
Bob Owens |
Sept 06, 2022 20:58 |
Sept 06, 2022 20:58 |
|
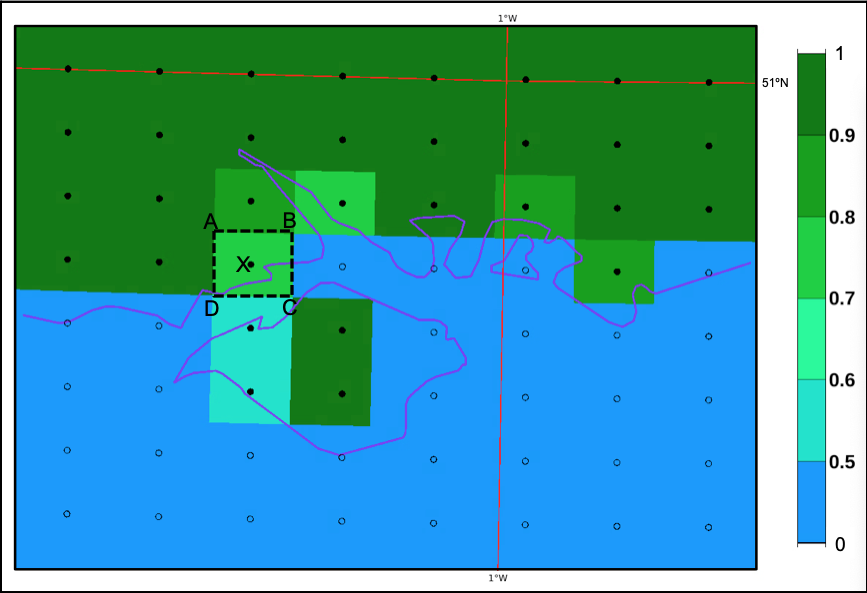
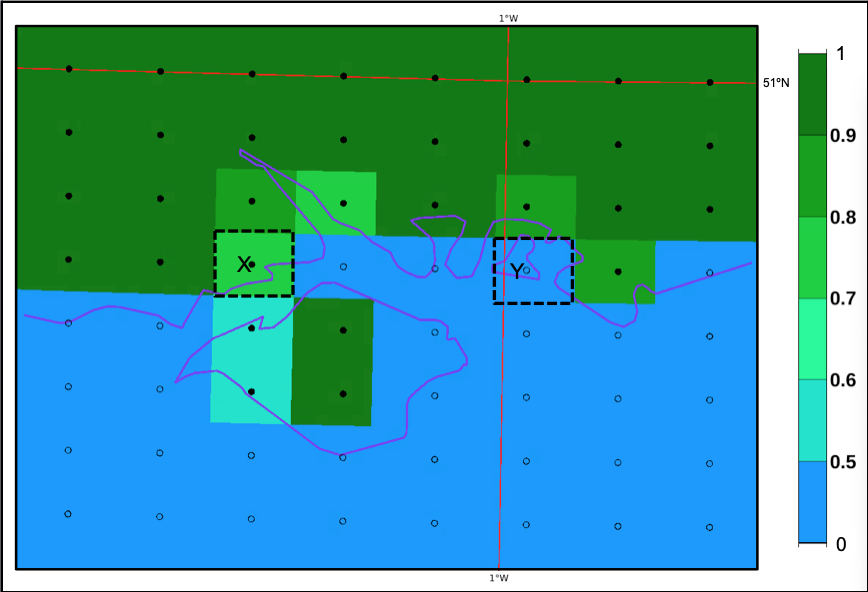
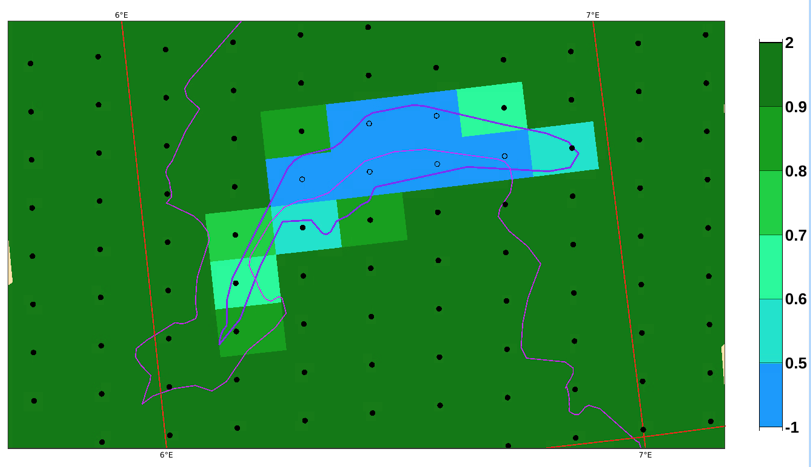
Page: Section 2.1.3.1 Land-Sea Mask
|
|
PNG File Screenshot 2023-02-16 at 16.44.49.png |
112 kB |
Bob Owens |
Feb 16, 2023 16:45 |
Feb 16, 2023 16:45 |
|
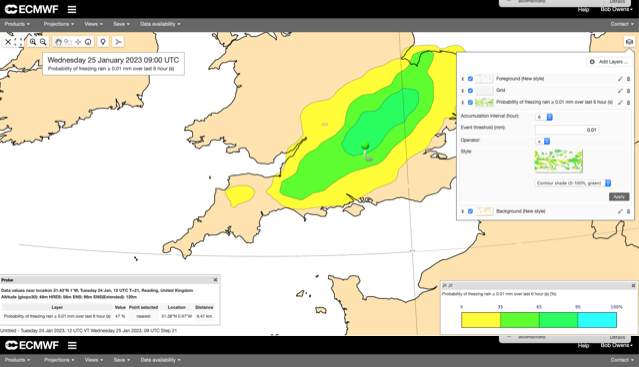
Page: Section 8.1.10 Types of Precipitation - charts and diagrams
|
|
PNG File Screenshot 2023-06-25 at 12.25.39.png |
112 kB |
Bob Owens |
Jun 25, 2023 12:26 |
Jun 25, 2023 12:26 |
|
Page: Section 8.1.4.1 Selection of grid points for Meteograms
|
|
PNG File Regime_Histogram_2.png |
111 kB |
Bob Owens |
May 02, 2023 20:46 |
May 02, 2023 20:46 |
|
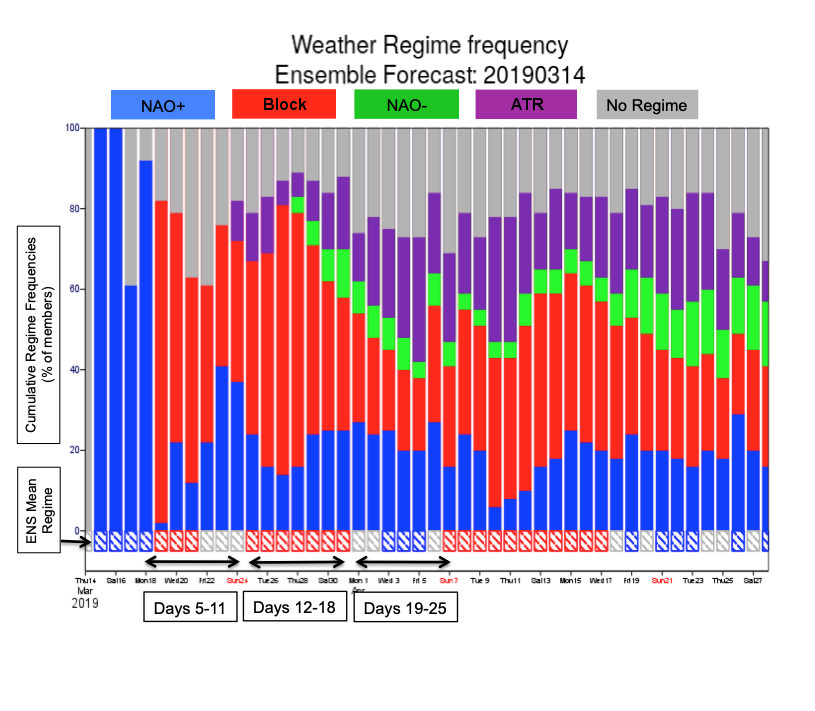
Page: Section 7.4 Regime Charts
|
|
PNG File Regime_Histogram_2.png |
111 kB |
Bob Owens |
Aug 25, 2022 10:02 |
Aug 25, 2022 10:02 |
|
Page: Section 8.2.5 Extended Range Regime Charts
|
|
PNG File Screenshot 2023-06-25 at 12.44.21.png |
111 kB |
Bob Owens |
Jun 25, 2023 12:44 |
Jun 25, 2023 12:44 |
|
Page: Section 8.1.4.1 Selection of grid points for Meteograms
|
|
PNG File Fig8.12.9 TropStrm Prob Ext ENS.png |
111 kB |
Bob Owens |
Aug 25, 2022 09:55 |
Aug 25, 2022 09:55 |
|
Page: Section 8.2.7 Tropical Storm Output
|
|
PNG File Screenshot 2023-01-25 at 22.51.12.png |
111 kB |
Bob Owens |
Feb 16, 2023 17:00 |
Feb 16, 2023 17:00 |
|
Page: Section 8.1.10 Types of Precipitation - charts and diagrams
|
|
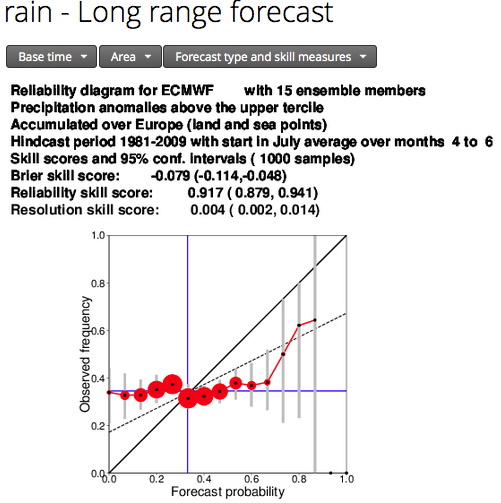
PNG File Fig8.13.9 Reliability Diag Rain Month4-6 Euro .png |
111 kB |
Bob Owens |
Aug 23, 2022 17:24 |
Aug 23, 2022 17:24 |
|
Page: Section 8.3.5 Using verification metrics with the output
|
|
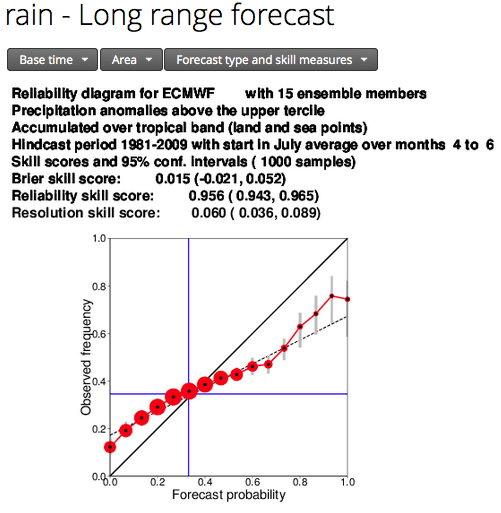
PNG File Fig8.13.9 Reliability Diag Rain Month4-6 Tropics .… |
111 kB |
Bob Owens |
Aug 23, 2022 17:24 |
Aug 23, 2022 17:24 |
|
Page: Section 8.3.5 Using verification metrics with the output
|
|
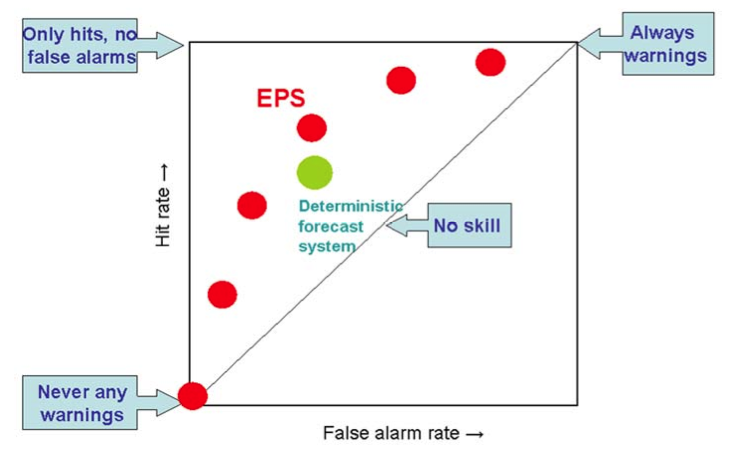
PNG File Fig10.B.10 ROC Diag2.png |
111 kB |
Bob Owens |
Jul 06, 2023 09:24 |
Jul 06, 2023 09:24 |
|
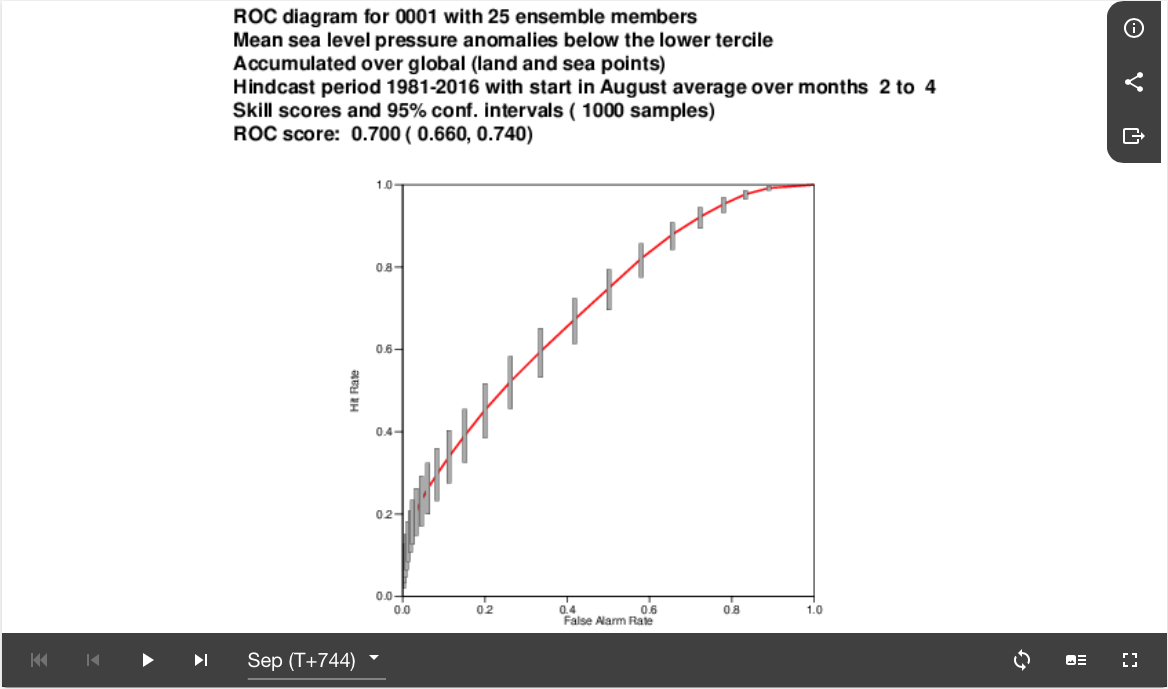
Page: Section 12.B Statistical Concepts - Probabilistic Data
|
|
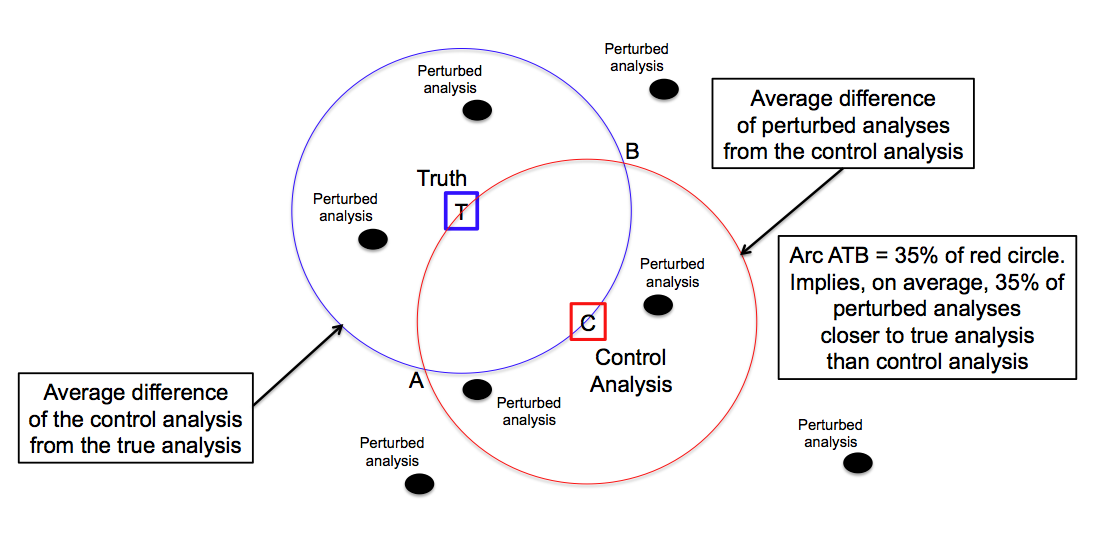
PNG File Fig5.1.6 Prtrb vs Ctrl.png |
110 kB |
Bob Owens |
Oct 23, 2022 15:24 |
Oct 23, 2022 15:24 |
|
Page: Section 5.1 Generation of the Ensemble
|
|
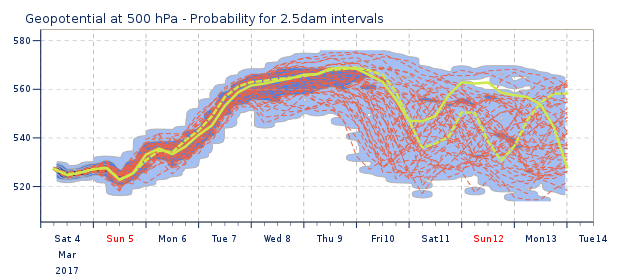
PNG File Fig29C Plume 500ht.png |
110 kB |
Bob Owens |
Aug 23, 2022 17:55 |
Aug 23, 2022 17:55 |
|
Page: Section 8.1.6 Plumes
|
|
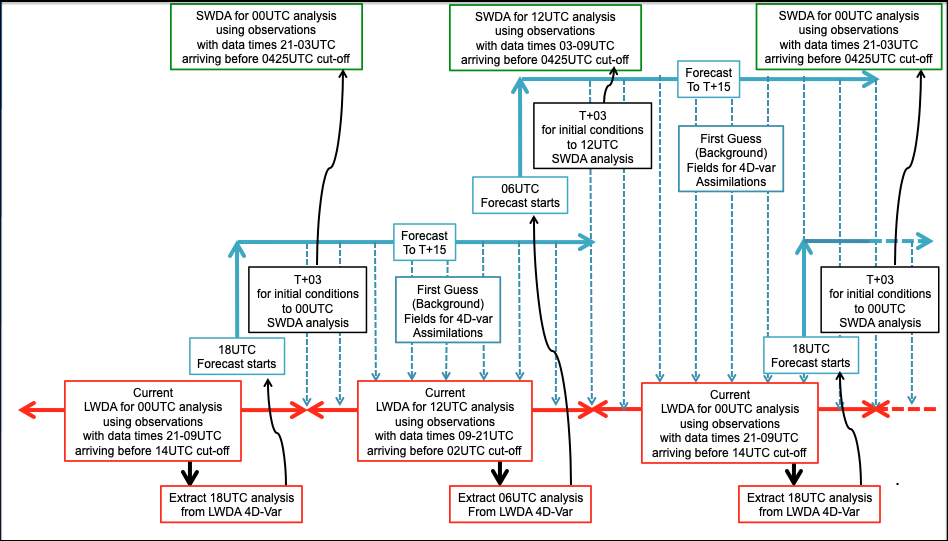
PNG File Screenshot 2021-05-10 at 22.25.37.png |
110 kB |
Bob Owens |
May 17, 2023 20:07 |
May 17, 2023 20:07 |
|
Page: Section 2.6 The Continuing Sequence of Analyses
|
|
PNG File Screenshot 2023-05-19 at 20.08.37.png |
110 kB |
Bob Owens |
Jun 30, 2023 22:41 |
Jun 30, 2023 22:41 |
|
Page: Section 2.1.3.1 Land-Sea Mask
|
|
PNG File Screenshot 2023-11-14 at 11.49.23.png |
110 kB |
Bob Owens |
Nov 14, 2023 11:50 |
Nov 14, 2023 11:50 |
|
Page: Section 8.3.3 Skill Scores
|