| Name
|
Size
|
Creator |
Creation Date
|
Last Modification Date
|
Labels |
Attached To |
|
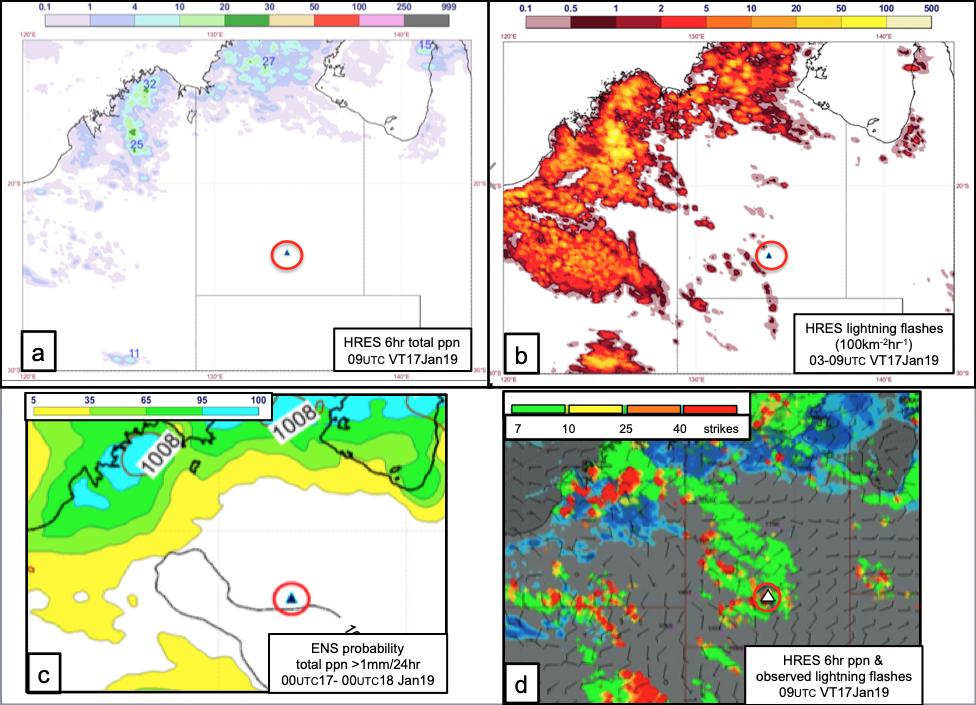
PNG File LightningAndPpnAustralia170119.png |
633 kB |
Bob Owens |
Sept 06, 2022 21:10 |
Sept 06, 2022 21:10 |
|
Page: Section 2.1.5.4 Convective Cloud Processes and Precipitation
|
|
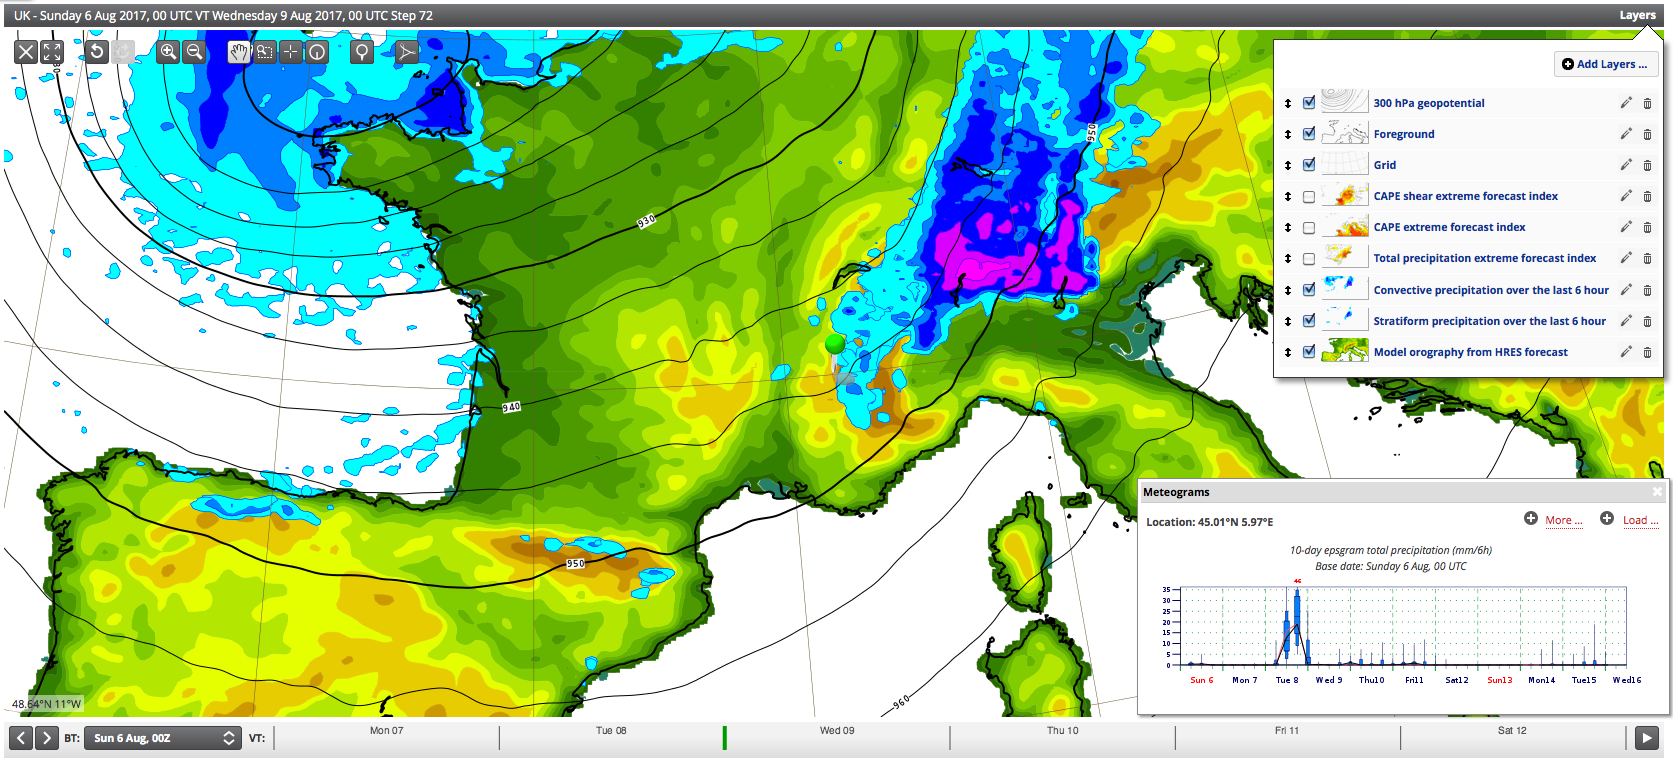
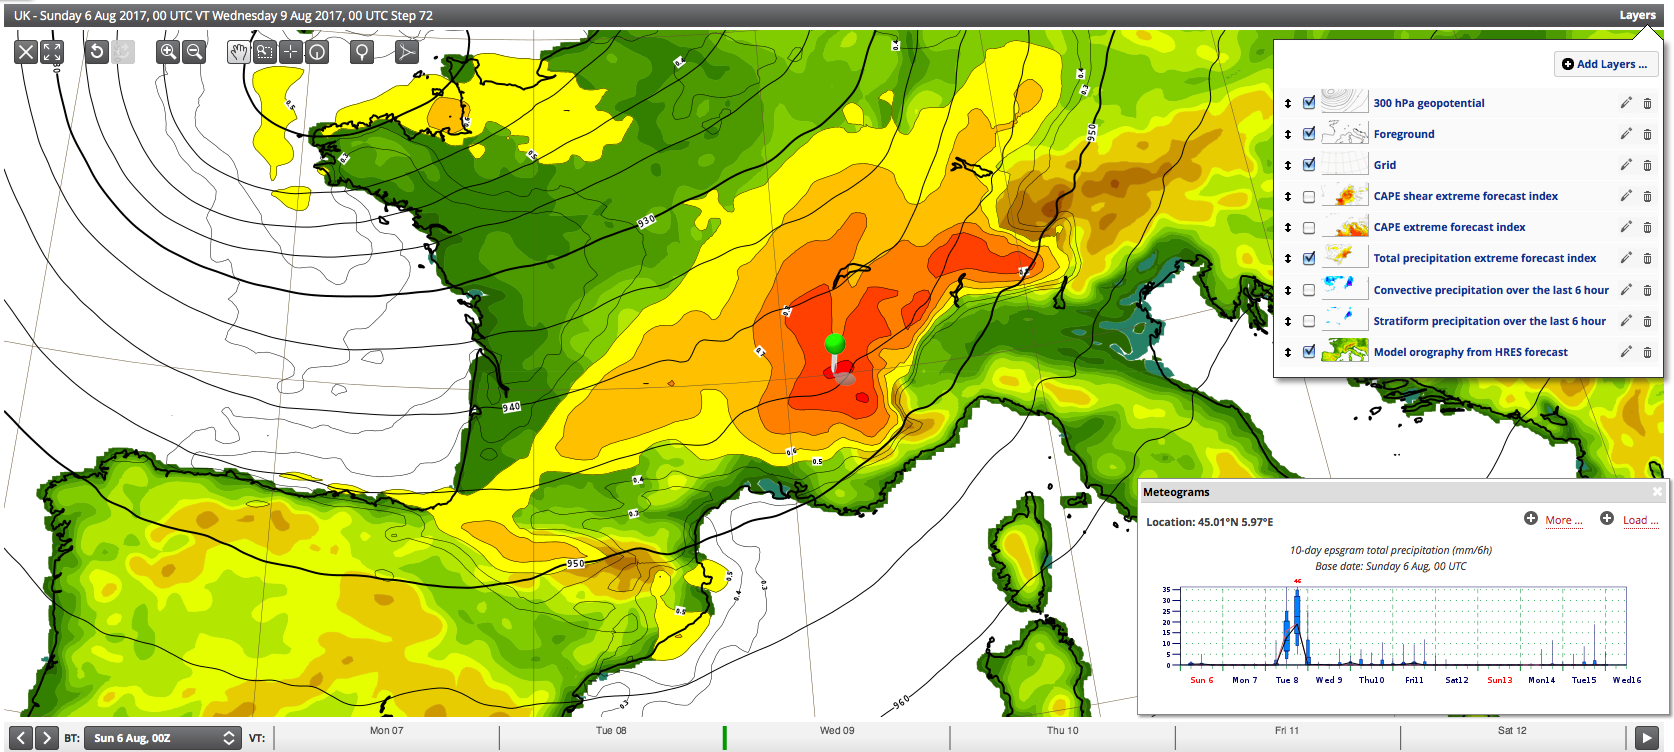
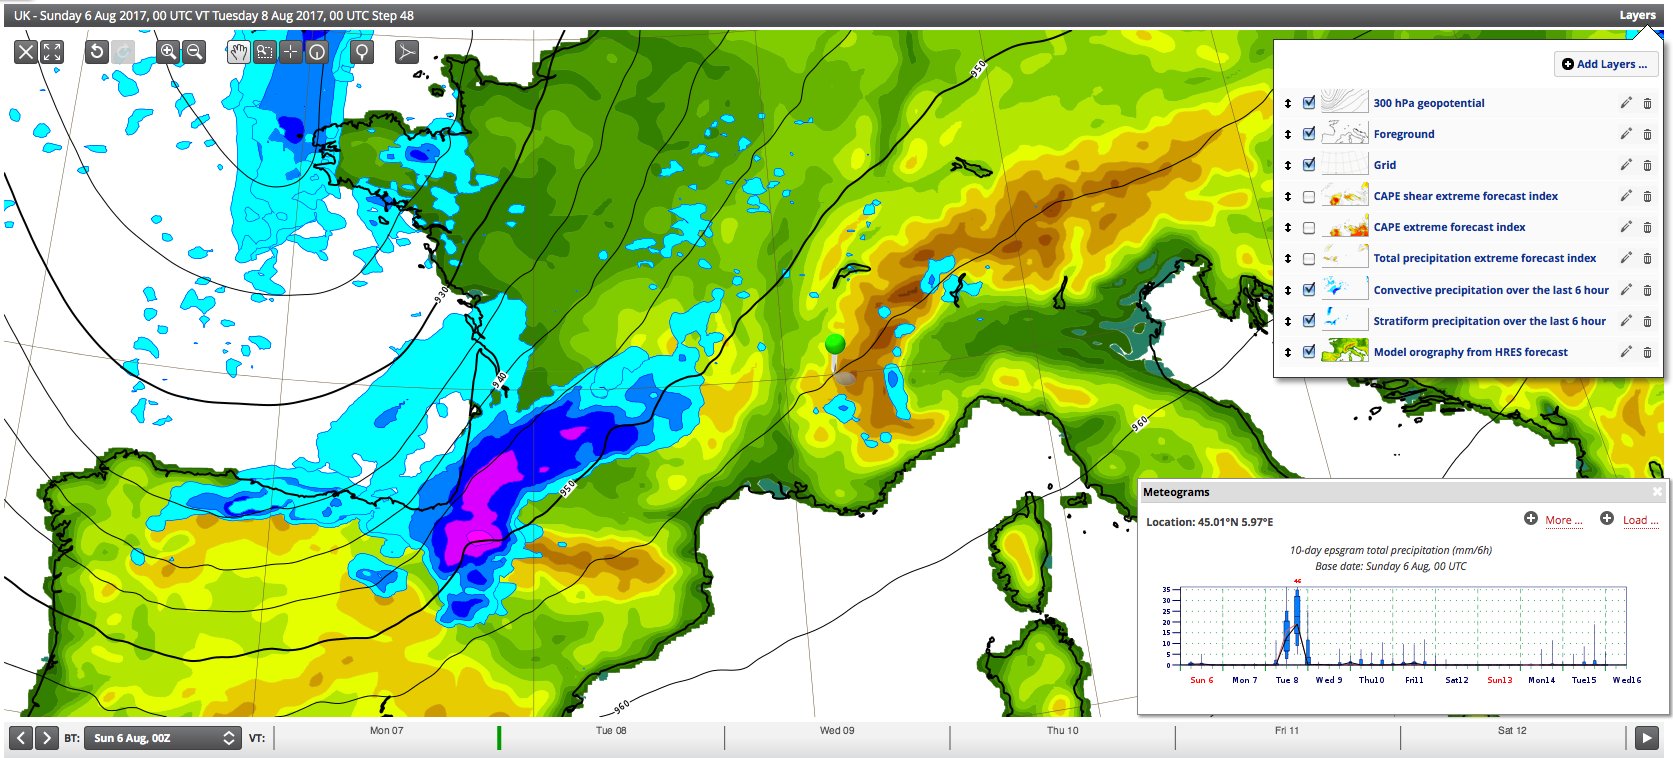
PNG File Fig8.7.5.12 HRES Rainfall VT00Z 090817.png |
631 kB |
Bob Owens |
Aug 23, 2022 17:33 |
Aug 23, 2022 17:33 |
|
Page: Section 8.1.9.6 Forecasting Severe Convective Hazards
|
|
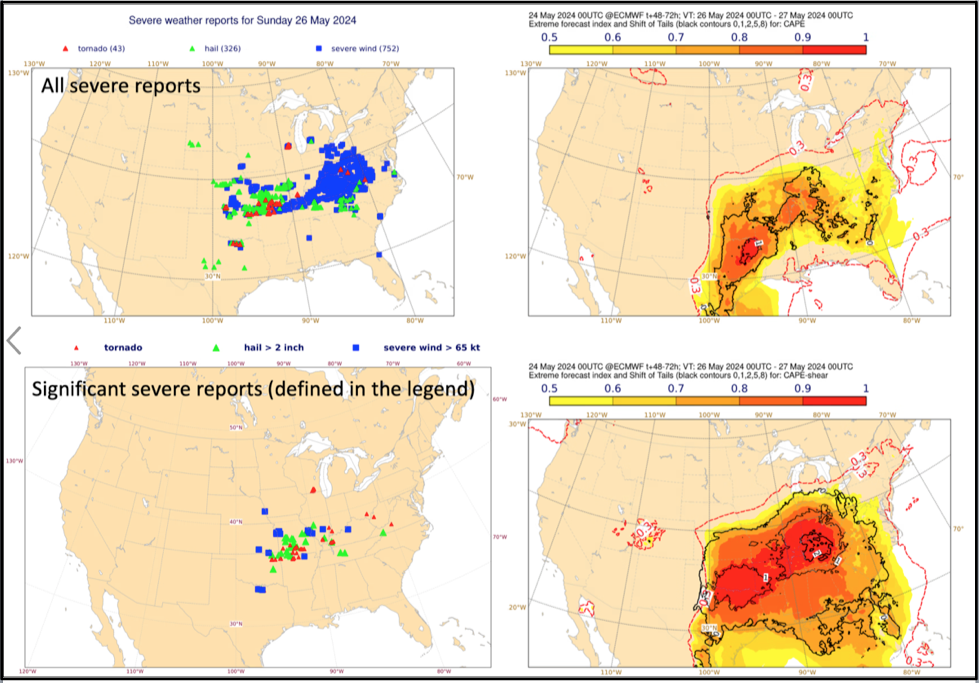
PNG File Fig8.7.5.14 ENS CAPE EFI VT00Z 090817.png |
630 kB |
Bob Owens |
Aug 23, 2022 17:33 |
Aug 23, 2022 17:33 |
|
Page: Section 8.1.9.6 Forecasting Severe Convective Hazards
|
|
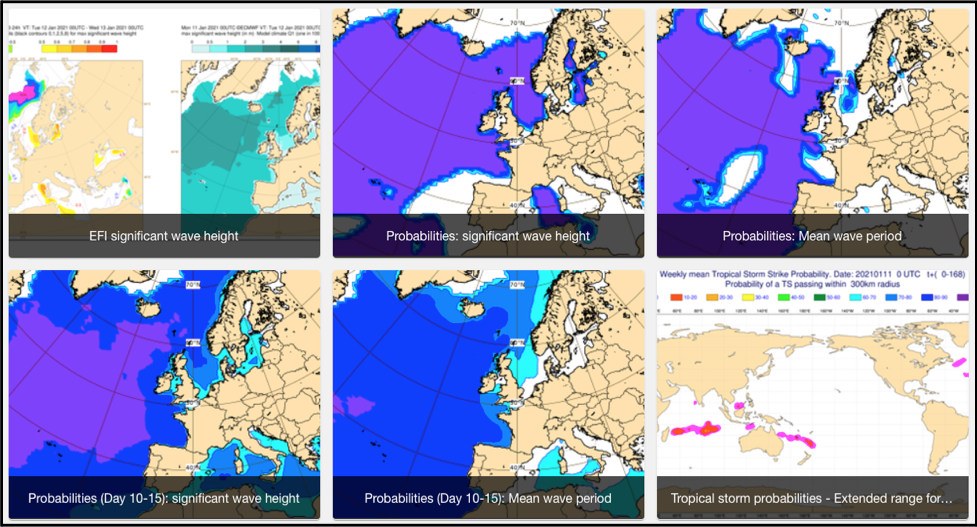
PNG File Screenshot 2021-02-03 at 14.08.09.png |
628 kB |
Bob Owens |
Aug 23, 2022 16:42 |
Aug 23, 2022 16:42 |
|
Page: Section 2.2 Ocean Wave Model - ECWAM
|
|
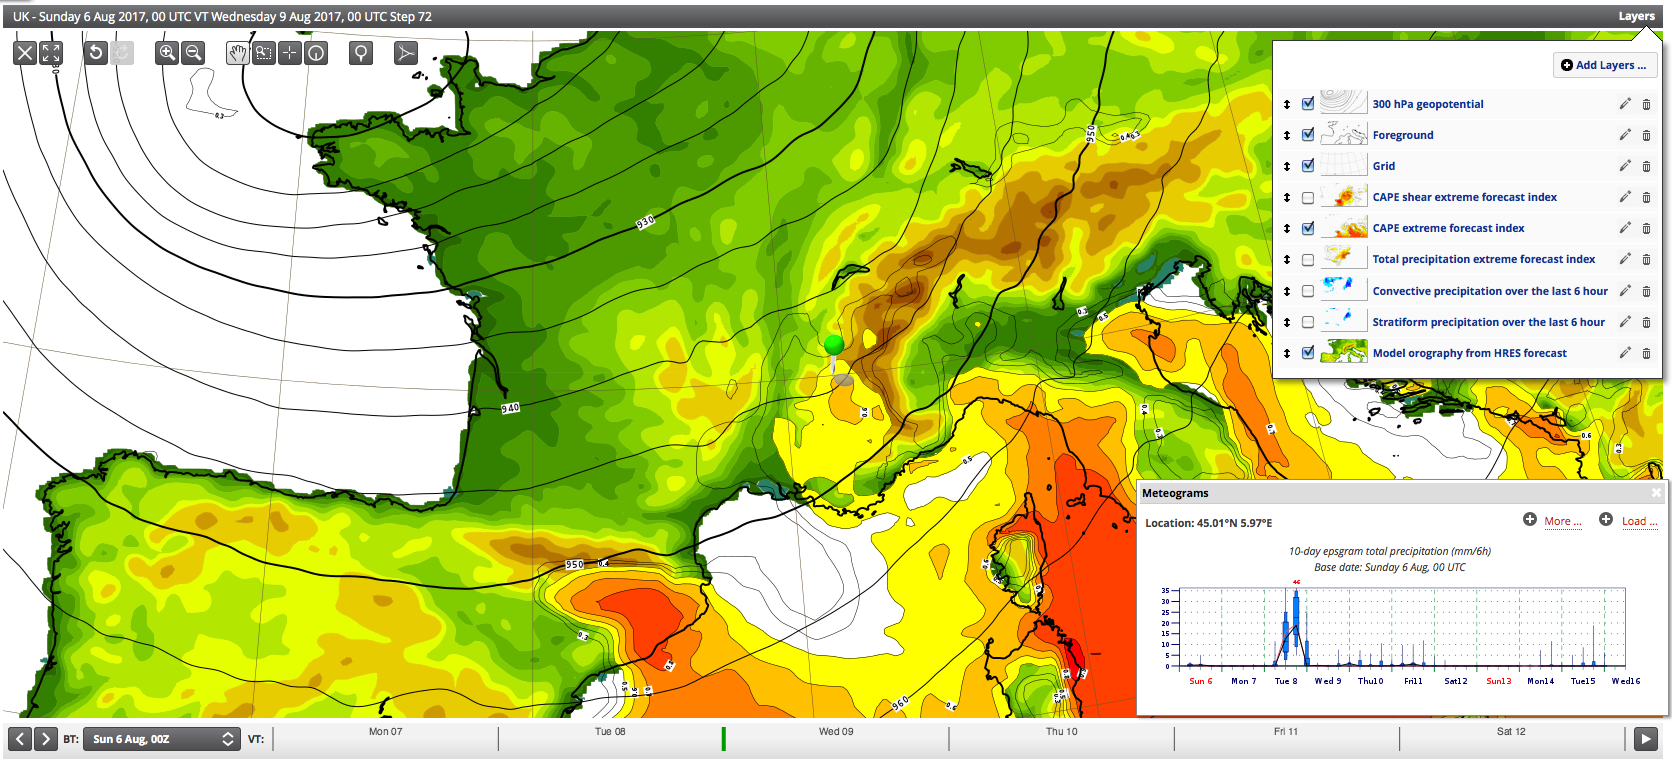
PNG File Fig8.7.5.13 ENS Rainfall EFI VT00Z 090817.png |
625 kB |
Bob Owens |
Aug 23, 2022 17:33 |
Aug 23, 2022 17:33 |
|
Page: Section 8.1.9.6 Forecasting Severe Convective Hazards
|
|
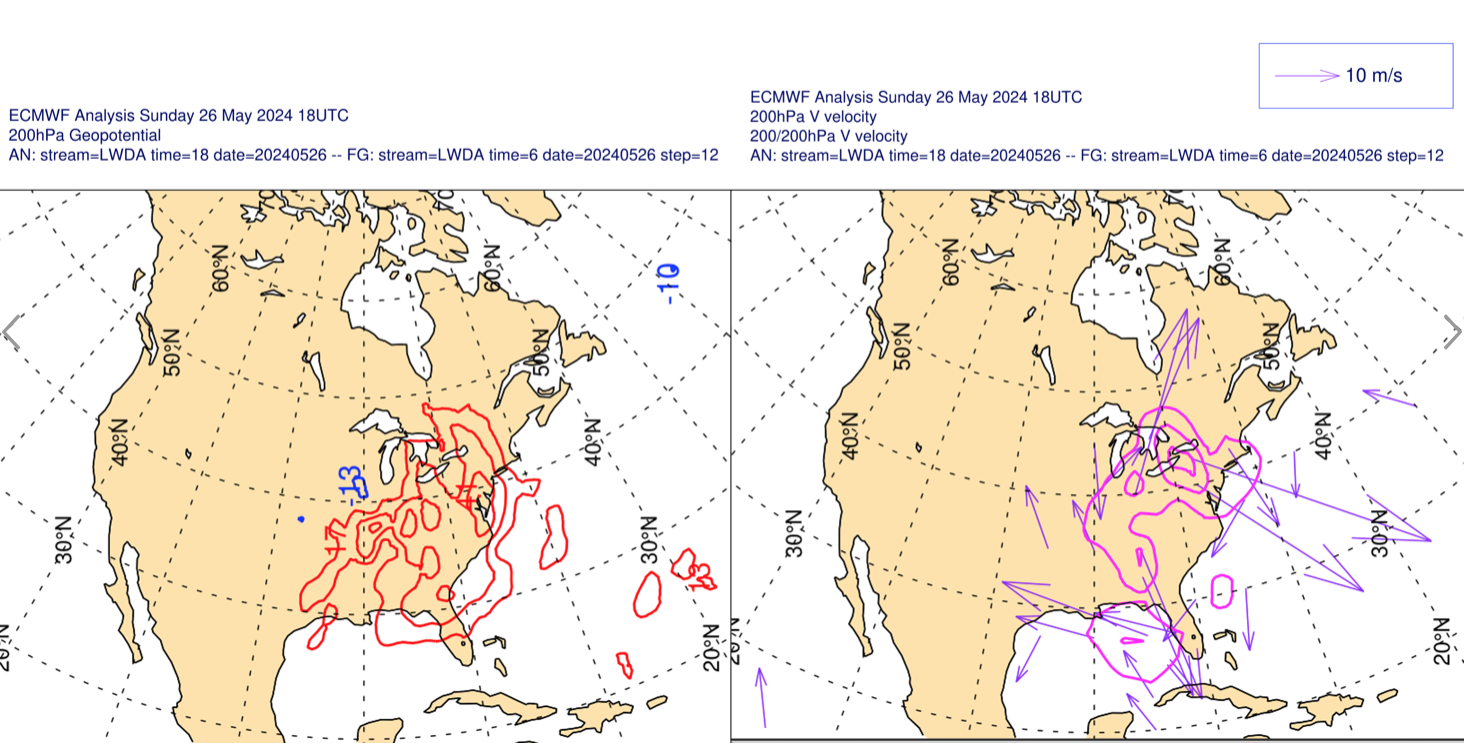
PNG File Screenshot 2024-06-14 at 17.18.31.png |
624 kB |
Bob Owens |
Jun 14, 2024 16:19 |
Jun 14, 2024 16:19 |
|
Page: Section 4.2 Analysis Increments
|
|
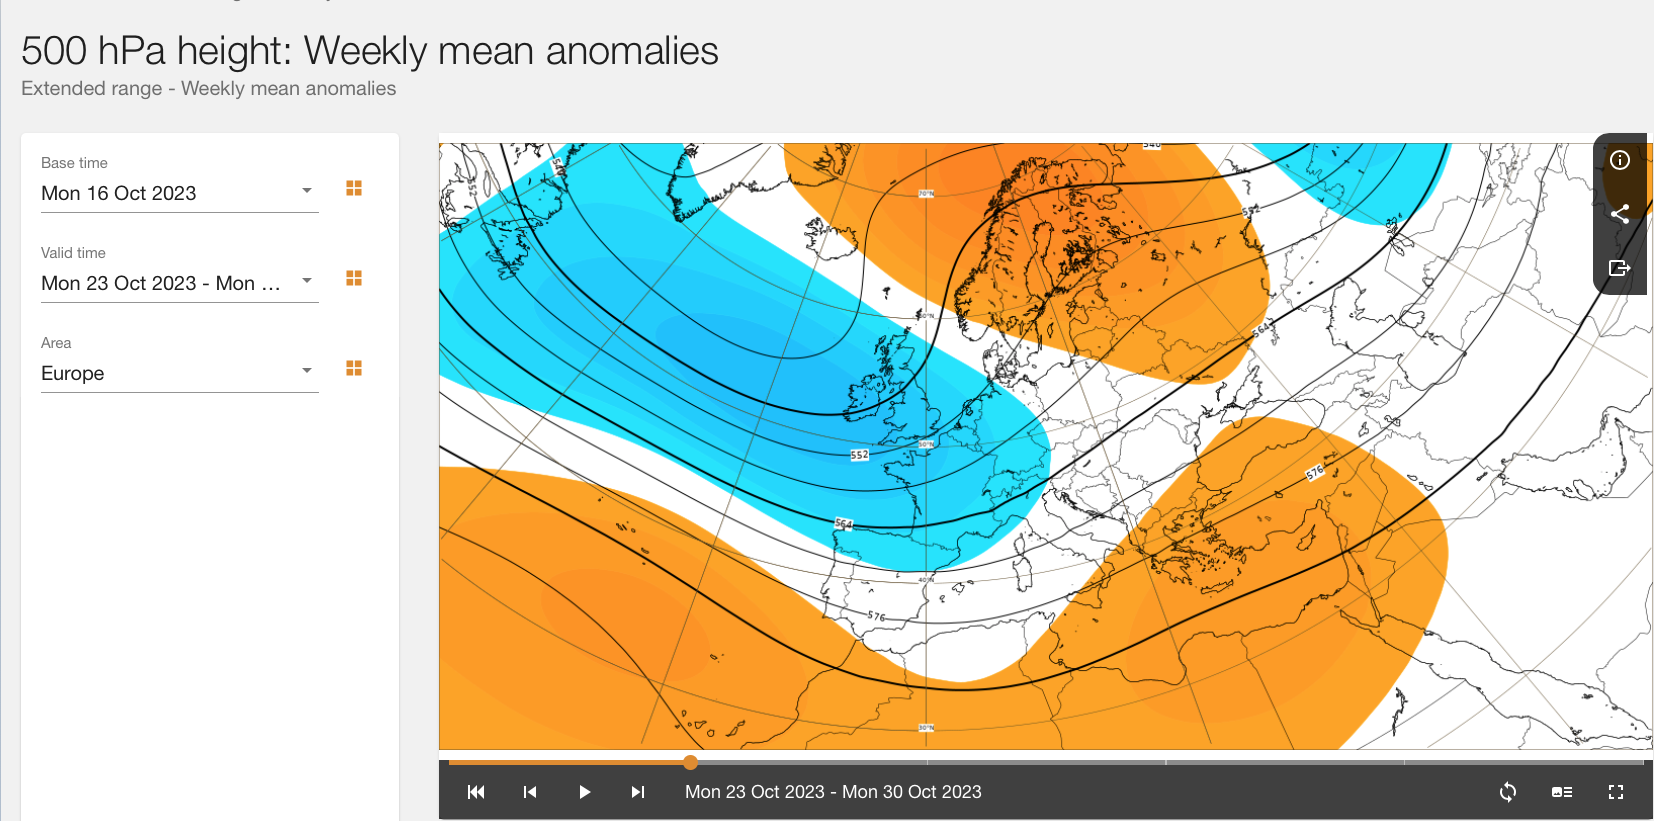
PNG File Screenshot 2023-10-28 at 14.47.18.png |
622 kB |
Bob Owens |
Oct 28, 2023 14:47 |
Oct 28, 2023 14:47 |
|
Page: Section 8.2.2 Circulation patterns or Regimes
|
|
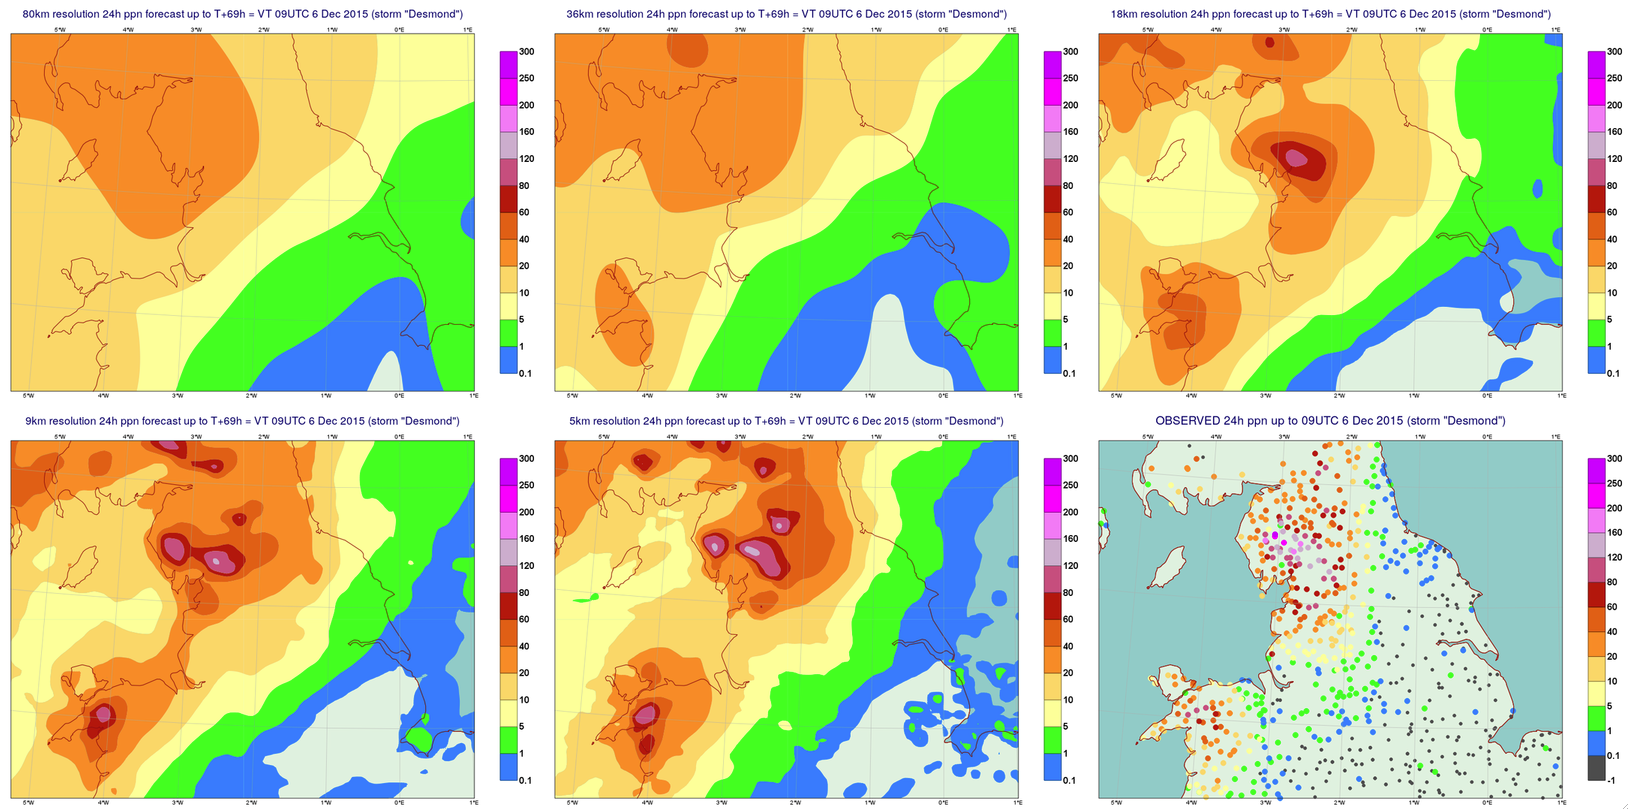
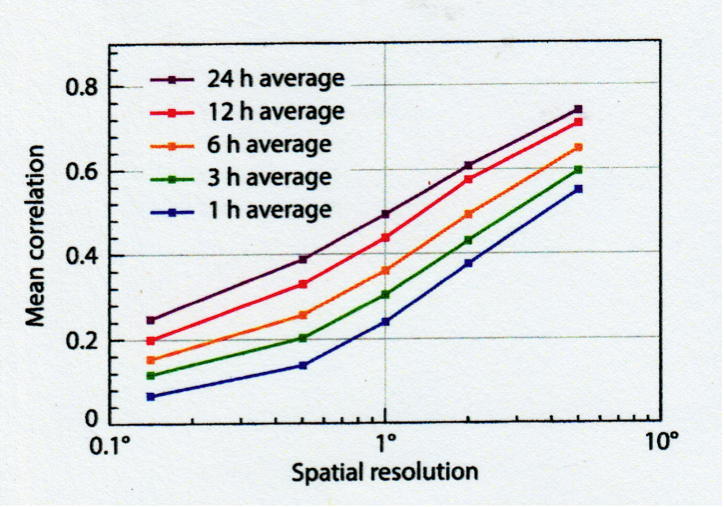
PNG File Fig2.1.1.2 RainfallTotalsVariousResolutions.png |
617 kB |
Bob Owens |
Sept 06, 2022 20:46 |
Sept 06, 2022 20:46 |
|
Page: Section 2.1.1.2 Rationale for High Resolution
|
|
PNG File Fig8.7.5.11 HRES Rainfall VT00Z 080817.png |
617 kB |
Bob Owens |
Aug 23, 2022 17:33 |
Aug 23, 2022 17:33 |
|
Page: Section 8.1.9.6 Forecasting Severe Convective Hazards
|
|
PNG File Screenshot 2024-06-14 at 11.33.09.png |
617 kB |
Bob Owens |
Jun 14, 2024 10:33 |
Jun 14, 2024 10:33 |
|
Page: Section 8.1.9.6 Forecasting Severe Convective Hazards
|
|
PNG File Fc Tephi Xsection 00Z 200820.png |
615 kB |
Bob Owens |
Aug 23, 2022 18:08 |
Aug 23, 2022 18:08 |
|
Page: Section 8.1.8 Vertical Profiles
|
|
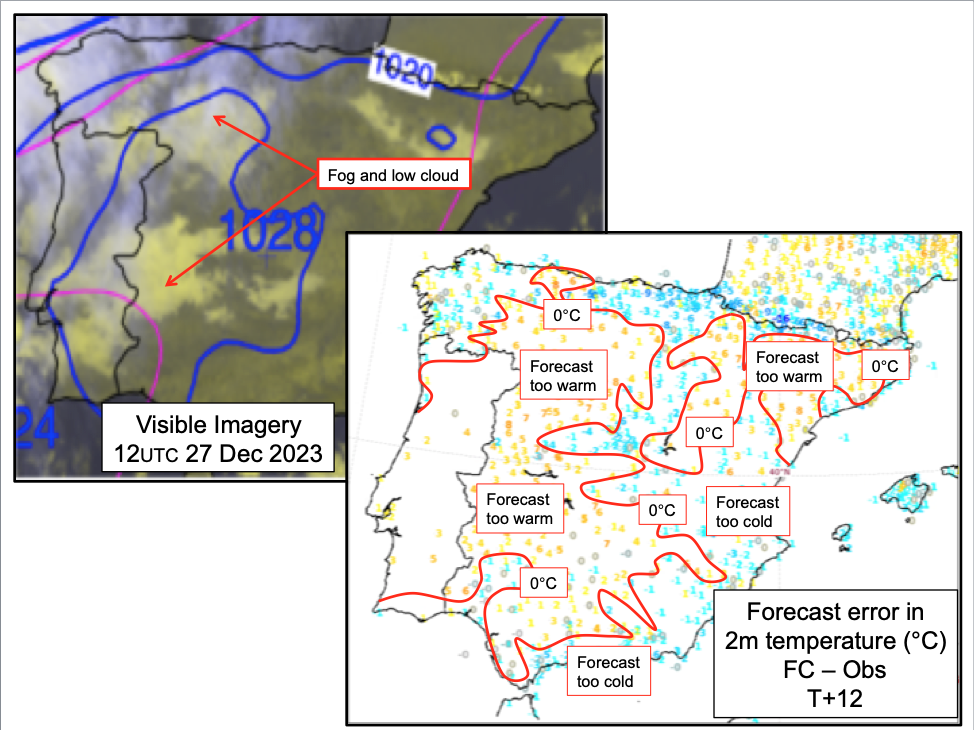
PNG File Screenshot 2023-12-31 at 16.13.50.png |
610 kB |
Bob Owens |
Dec 31, 2023 16:14 |
Dec 31, 2023 16:14 |
|
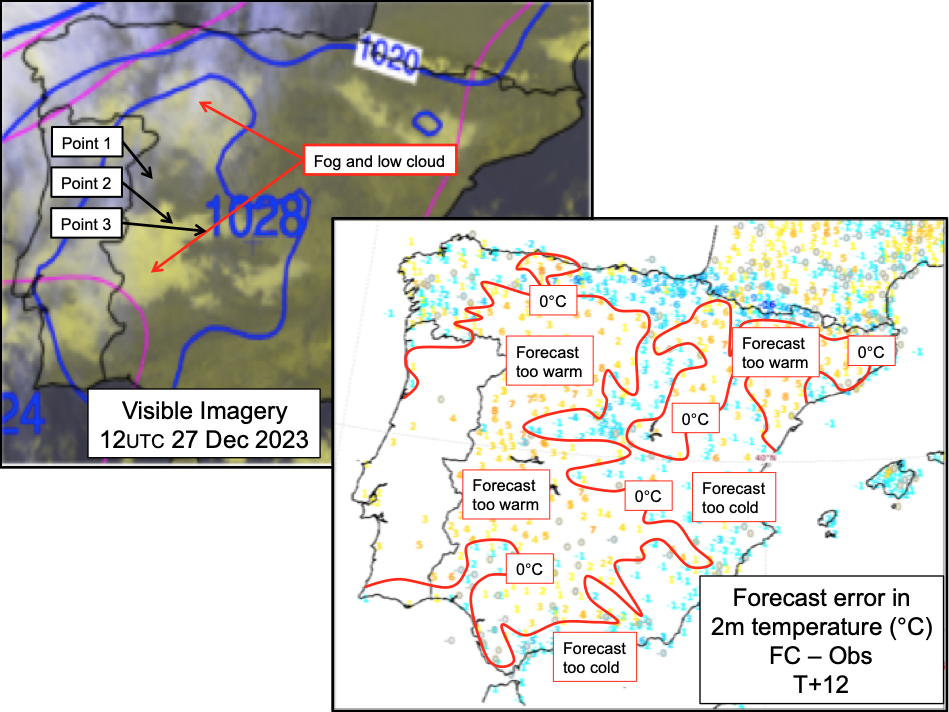
Page: Section 9.2.1 Causes of Errors in Forecast Temperature and Humidity
|
|
PNG File Fig10.2.12 Lightning Spacial Resolution.png |
608 kB |
Bob Owens |
Aug 23, 2022 18:08 |
Aug 23, 2022 18:08 |
|
Page: Section 8.1.13 Lightning
|
|
PNG File Fig10.2.12 Lightning Spacial Resolution.png |
608 kB |
Bob Owens |
May 03, 2023 21:07 |
May 03, 2023 21:07 |
|
Page: Section 8.1.7 Point Rainfall
|
|
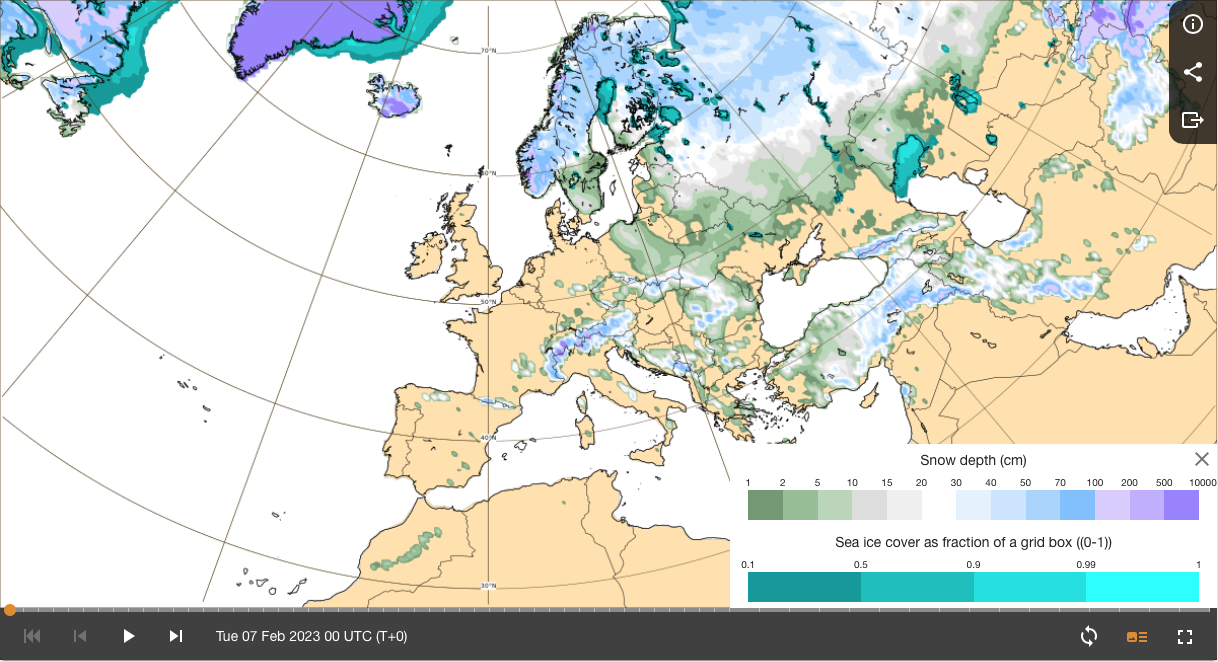
PNG File Screenshot 2023-02-07 at 13.56.47.png |
607 kB |
Bob Owens |
Mar 05, 2023 11:31 |
Mar 05, 2023 11:31 |
|
Page: Section 2.1.4.4 Modelling snow structure
|
|
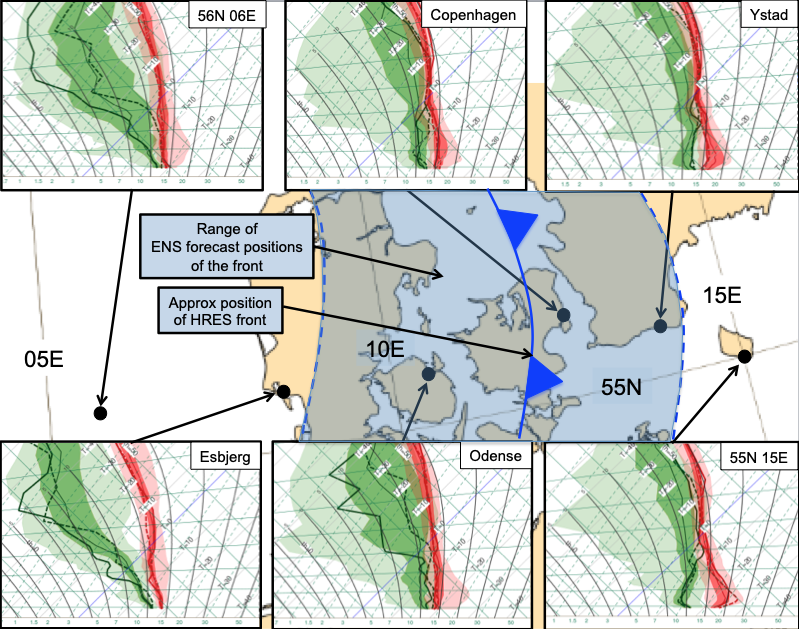
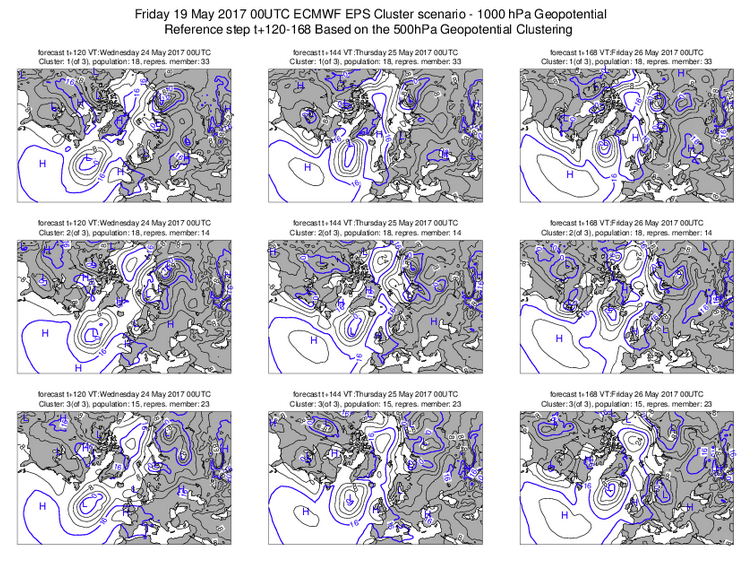
PNG File Fig6.1.2 ClusterPostageStampsSurface.png |
606 kB |
Bob Owens |
Aug 23, 2022 17:25 |
Aug 23, 2022 17:25 |
|
Page: Section 8.1.1 Basic ensemble products
|
|
PNG File Screenshot 2024-06-14 at 16.34.37.png |
604 kB |
Bob Owens |
Jun 14, 2024 16:02 |
Jun 14, 2024 16:02 |
|
Page: Section 4.2 Analysis Increments
|
|
PNG File Screenshot 2023-12-31 at 18.27.13.png |
604 kB |
Bob Owens |
Dec 31, 2023 18:27 |
Dec 31, 2023 18:27 |
|
Page: Section 9.2.1 Causes of Errors in Forecast Temperature and Humidity
|
|
PNG File Screenshot 2024-01-08 at 17.05.33.png |
603 kB |
Bob Owens |
Mar 14, 2024 12:16 |
Mar 14, 2024 12:16 |
|
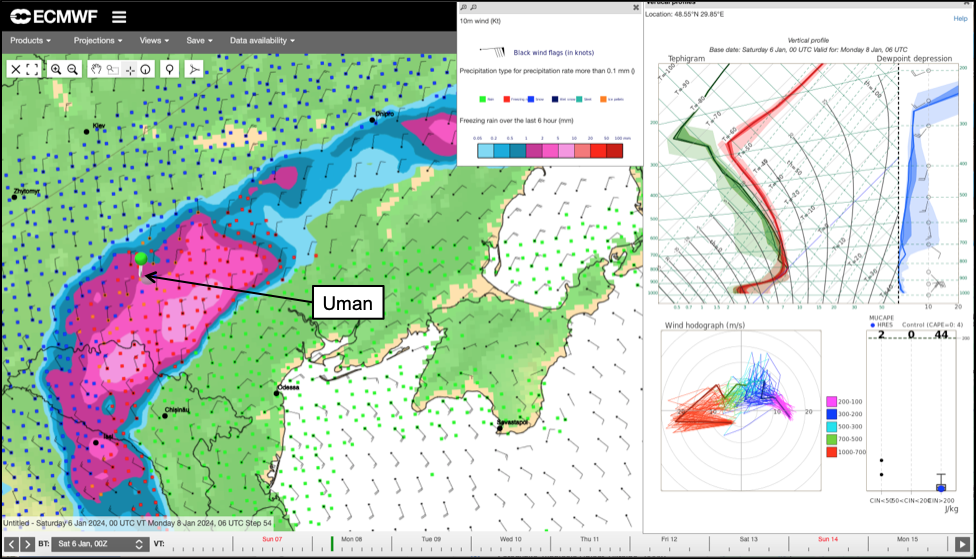
Page: Section8.1.10.1 Examples of freezing precipitation - charts and diagrams
|
|
PNG File Screenshot 2024-01-08 at 17.05.33.png |
603 kB |
Bob Owens |
Jan 09, 2024 16:46 |
Jan 09, 2024 16:46 |
|
Page: Section 8.1.10 Types of Precipitation - charts and diagrams
|