| Name
|
Size
|
Creator |
Creation Date
|
Last Modification Date
|
Labels |
Attached To |
|
PNG File Screenshot 2021-05-12 at 11.55.12.png |
110 kB |
Bob Owens |
May 17, 2023 20:07 |
May 17, 2023 20:07 |
|
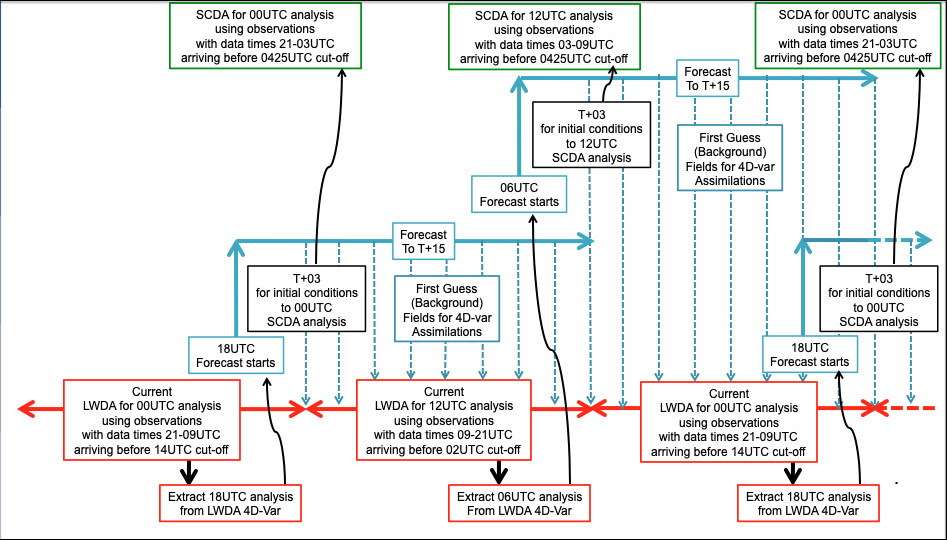
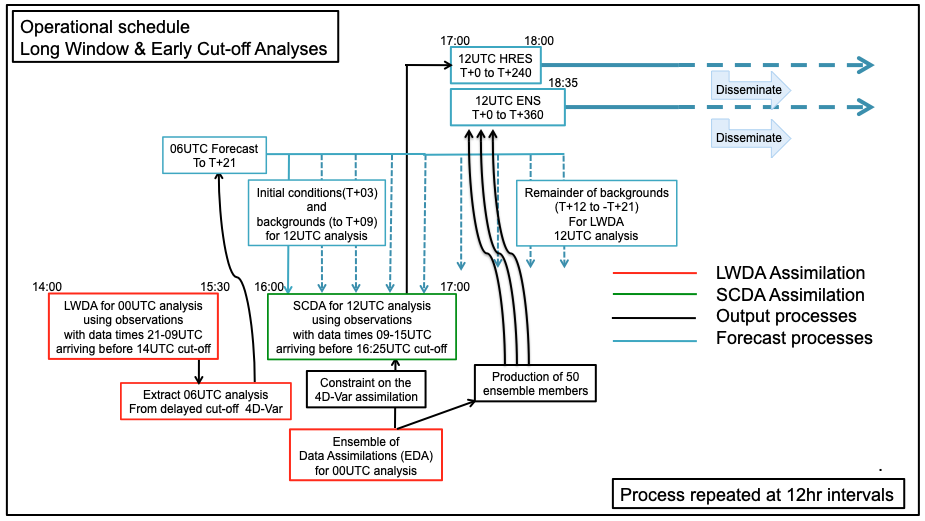
Page: Section 2.6 The Continuing Sequence of Analyses
|
|
PNG File Screenshot 2021-05-12 at 12.01.48.png |
109 kB |
Bob Owens |
May 17, 2023 20:07 |
May 17, 2023 20:07 |
|
Page: Section 2.6 The Continuing Sequence of Analyses
|
|
PNG File Fig8.8.2.4 Bifurcating TC Intensity Probs 010817.p… |
109 kB |
Bob Owens |
Aug 23, 2022 18:02 |
Aug 23, 2022 18:02 |
|
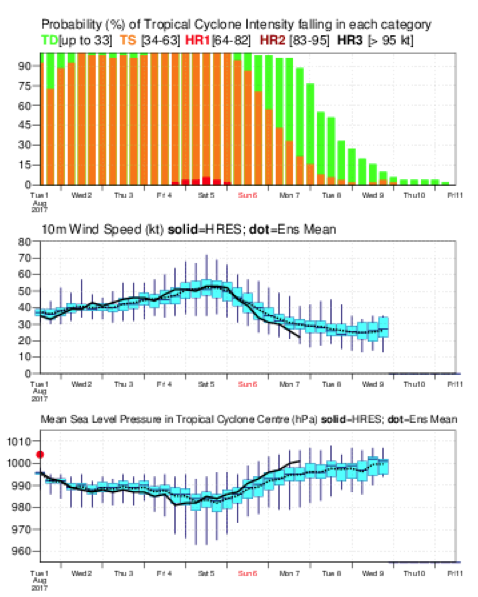
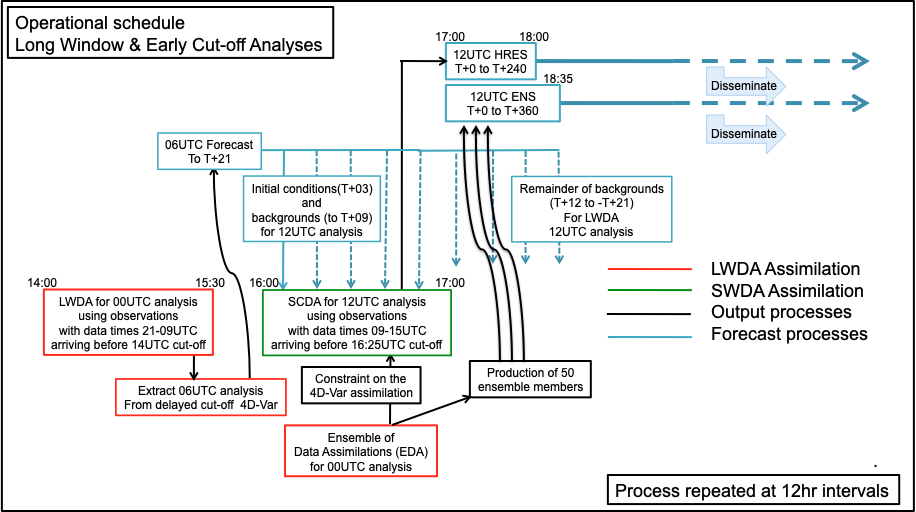
Page: Section 8.1.16.3 Considerations when using Tropical Cyclone products
|
|
PNG File Fig35C Anom Corr 850hPa Temp.png |
109 kB |
Bob Owens |
Aug 23, 2022 17:11 |
Aug 23, 2022 17:11 |
|
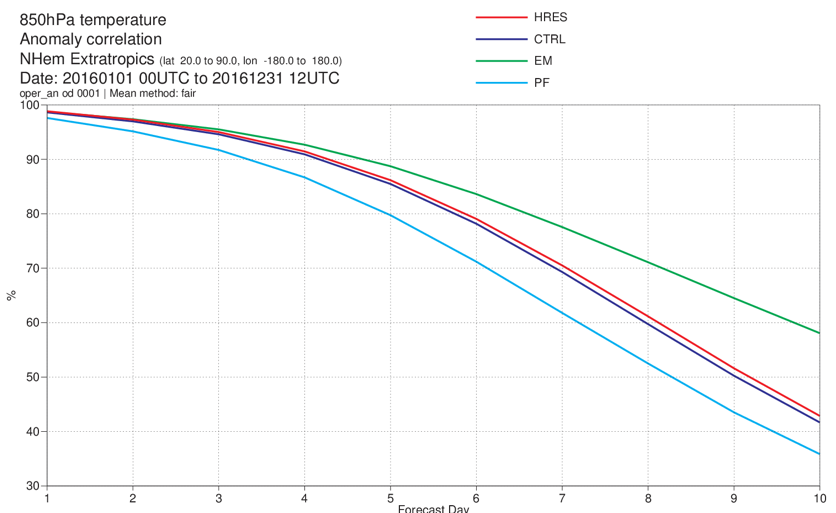
Page: Section 6.2.2 Anomaly Correlation Coefficient
|
|
PNG File Fig3.3.11 StatesConvectionHtDeparture.png |
109 kB |
Bob Owens |
Aug 23, 2022 16:53 |
Aug 23, 2022 16:53 |
|
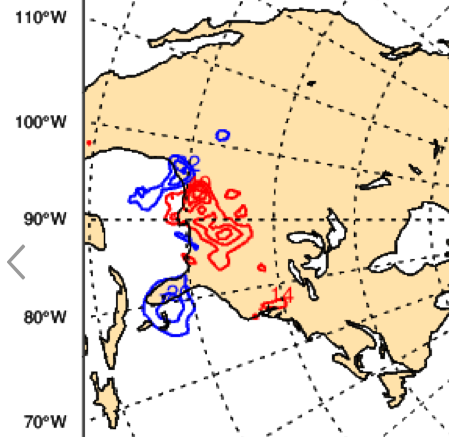
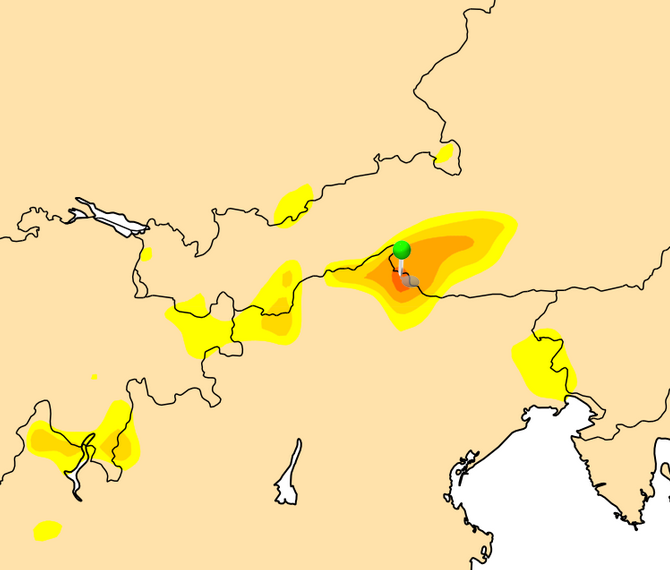
Page: Section 4.2 Analysis Increments
|
|
PNG File Screenshot 2023-06-30 at 22.51.11.png |
109 kB |
Bob Owens |
Jun 30, 2023 22:51 |
Jun 30, 2023 22:51 |
|
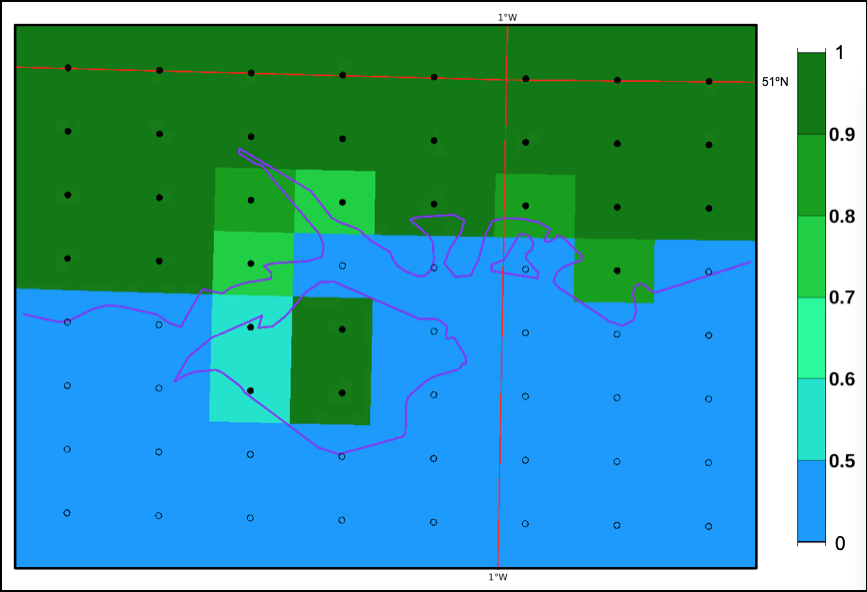
Page: Section 2.1.3.1 Land-Sea Mask
|
|
PNG File Screenshot 2021-05-12 at 11.55.31.png |
109 kB |
Bob Owens |
May 17, 2023 20:07 |
May 17, 2023 20:07 |
|
Page: Section 2.6 The Continuing Sequence of Analyses
|
|
PNG File Fig59g More than 60kt in 300km.png |
108 kB |
Bob Owens |
Aug 23, 2022 17:56 |
Aug 23, 2022 17:56 |
|
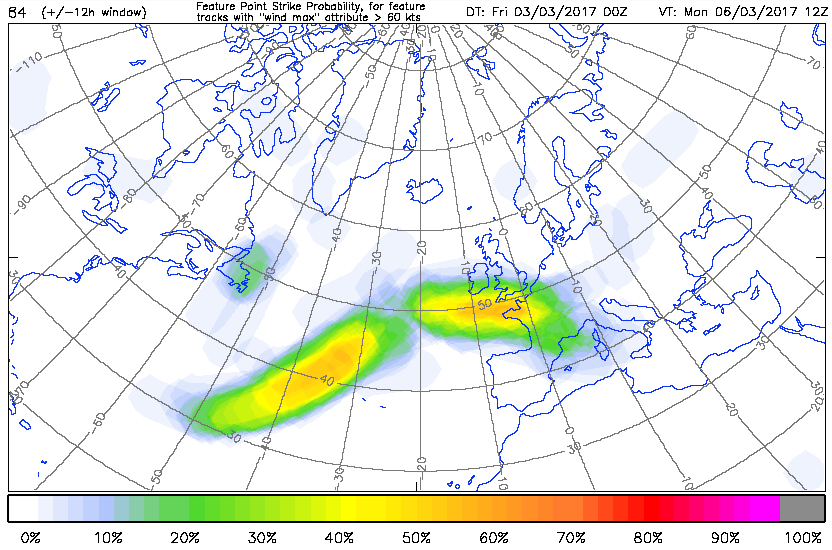
Page: Section 8.1.15 Extra-tropical Cyclone Diagrams
|
|
PNG File Fig59g More than 60kt in 300km.png |
108 kB |
Bob Owens |
Aug 23, 2022 17:57 |
Aug 23, 2022 17:57 |
|
Page: Section 8.1.15.1 New Product Format From 18 May 2021
|
|
PNG File Fig9.6.4 TSRA CAPESHEAR EFI VT00Z 111217 T+24 DT 0… |
108 kB |
Bob Owens |
Aug 25, 2022 10:12 |
Aug 25, 2022 10:12 |
|
Page: Section 9.6 Convective Precipitation
|
|
PNG File Fig9.6.4 TSRA CAPESHEAR EFI VT00Z 111217 T+24 DT 0… |
108 kB |
Bob Owens |
May 08, 2023 13:14 |
May 08, 2023 13:14 |
|
Page: Section 9.6.1 Examples of convection problems
|
|
PNG File Fig35B Anom Corr 500hPa Ht.png |
108 kB |
Bob Owens |
Aug 23, 2022 17:11 |
Aug 23, 2022 17:11 |
|
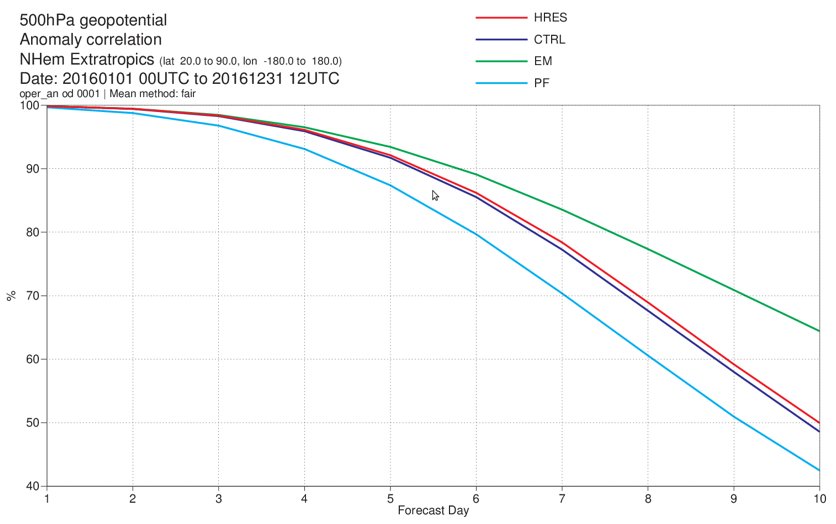
Page: Section 6.2.2 Anomaly Correlation Coefficient
|
|
PNG File Screenshot 2023-10-27 at 20.58.59.png |
107 kB |
Bob Owens |
Oct 27, 2023 20:59 |
Oct 27, 2023 20:59 |
|
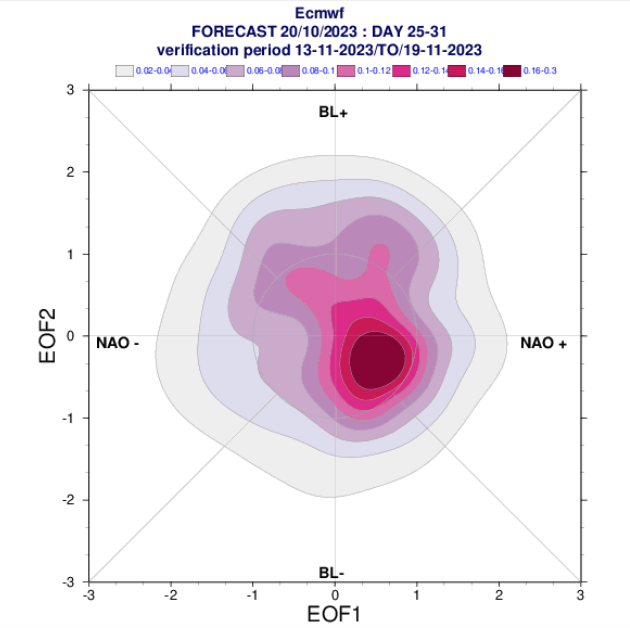
Page: Section 8.2.2 Circulation patterns or Regimes
|
|
PNG File Screenshot 2021-05-10 at 22.22.20.png |
107 kB |
Bob Owens |
May 17, 2023 20:07 |
May 17, 2023 20:07 |
|
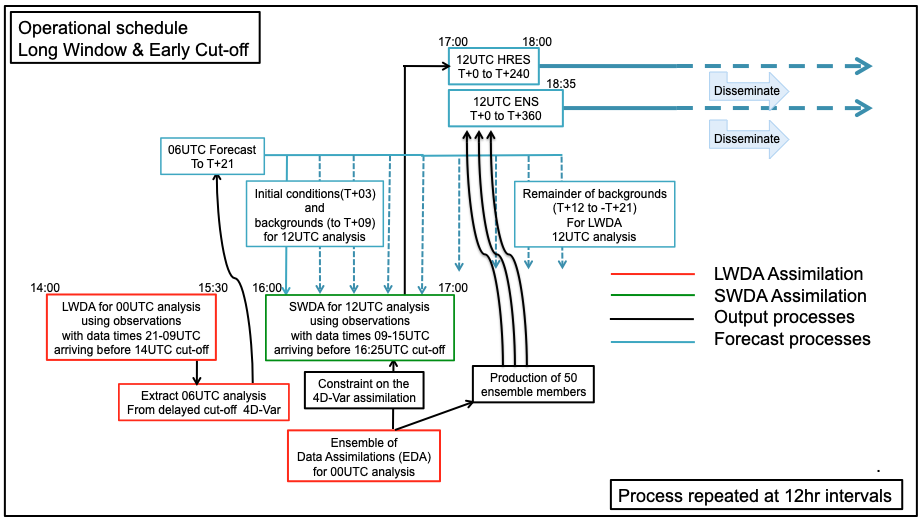
Page: Section 2.6 The Continuing Sequence of Analyses
|
|
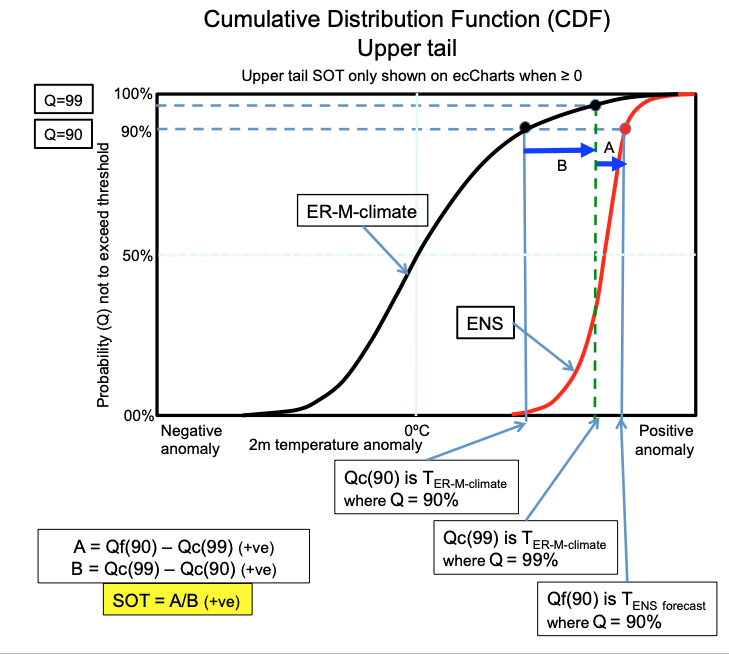
PNG File CDF Upper Tail ER +SOT.png |
107 kB |
Bob Owens |
Aug 25, 2022 09:57 |
Aug 25, 2022 09:57 |
|
Page: Section 8.2.4 Extended Range - CDFs, EFI and SOT
|
|
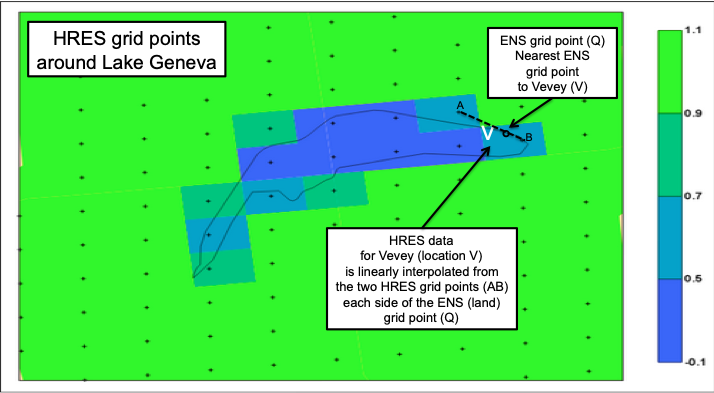
PNG File Screenshot 2019-05-25 at 14.37.03.png |
107 kB |
Bob Owens |
Aug 23, 2022 17:40 |
Aug 23, 2022 17:40 |
|
Page: Section 8.1.4.1 Selection of grid points for Meteograms
|
|
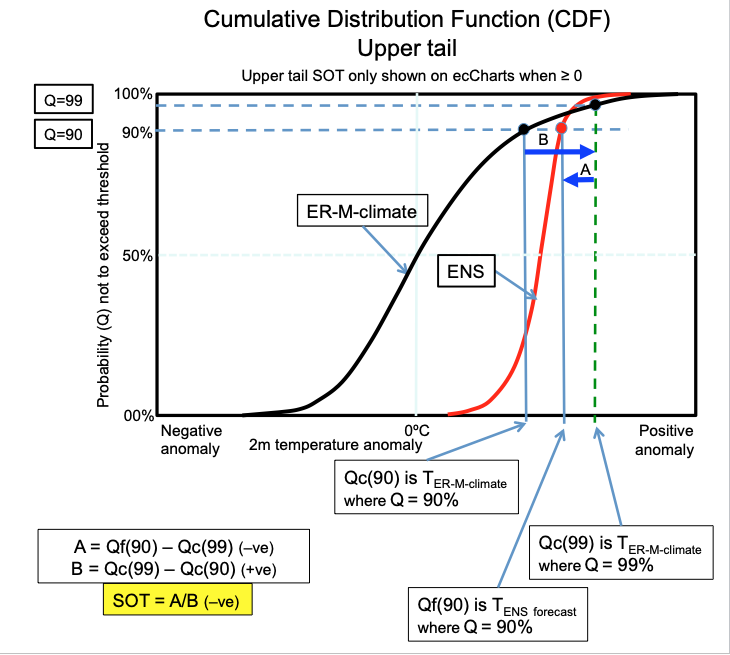
PNG File CDF Upper Tail ER –SOT.png |
107 kB |
Bob Owens |
Aug 25, 2022 09:57 |
Aug 25, 2022 09:57 |
|
Page: Section 8.2.4 Extended Range - CDFs, EFI and SOT
|
|
PNG File Fig29A Plume 850Temp.png |
106 kB |
Bob Owens |
Aug 23, 2022 17:55 |
Aug 23, 2022 17:55 |
|
Page: Section 8.1.6 Plumes
|
|
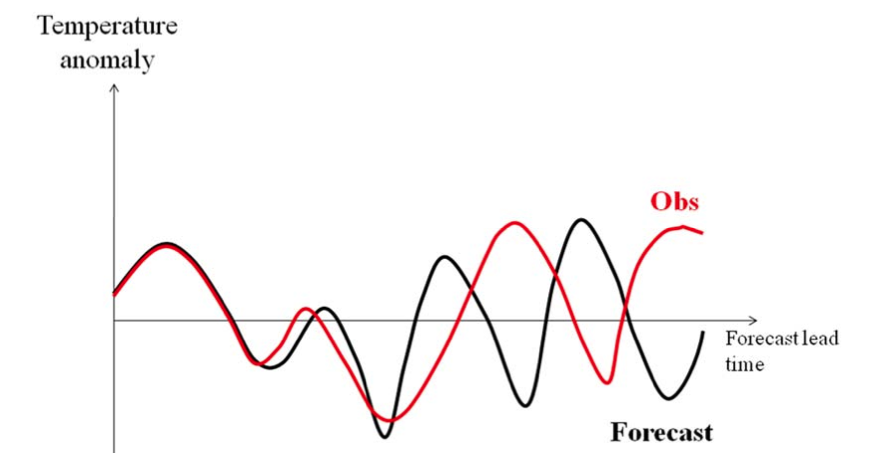
PNG File Fig10.A.3 PhaseErrors&Anomalies.png |
106 kB |
Bob Owens |
Jul 06, 2023 09:22 |
Jul 06, 2023 09:22 |
|
Page: Section 12.A Statistical Concepts - Deterministic Data
|
|
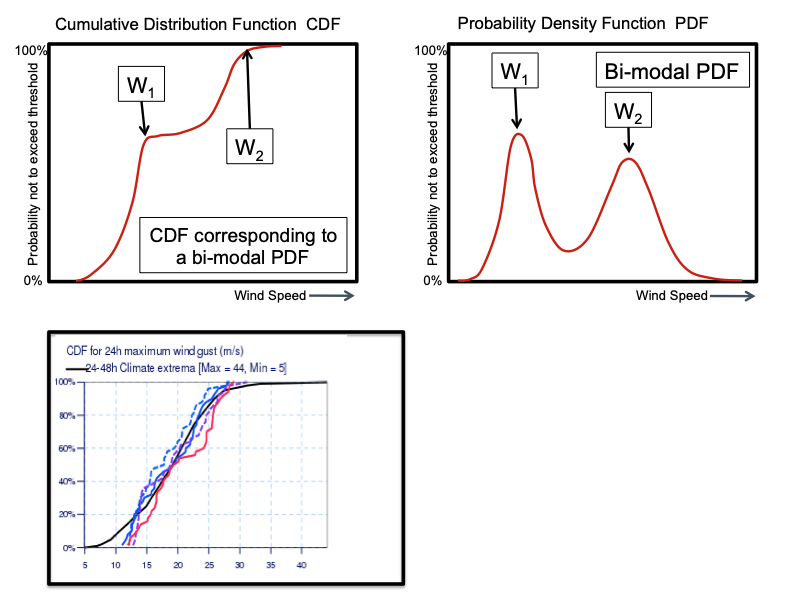
PNG File Screenshot 2021-06-29 at 12.33.56.png |
106 kB |
Bob Owens |
Aug 23, 2022 17:31 |
Aug 23, 2022 17:31 |
|
Page: Section 8.1.9.1 Cumulative Distribution Function, Probability Density Function
|