| Name
|
Size
|
Creator |
Creation Date
|
Last Modification Date
|
Labels |
Attached To |
|
PNG File Screenshot 2020-12-21 at 13.10.09.png |
91 kB |
Bob Owens |
Aug 25, 2022 09:57 |
Aug 25, 2022 09:57 |
|
Page: Section 8.2.4 Extended Range - CDFs, EFI and SOT
|
|
PNG File Fig8.12.2 Bratislava Plume 170717.png |
91 kB |
Bob Owens |
Aug 25, 2022 09:56 |
Aug 25, 2022 09:56 |
|
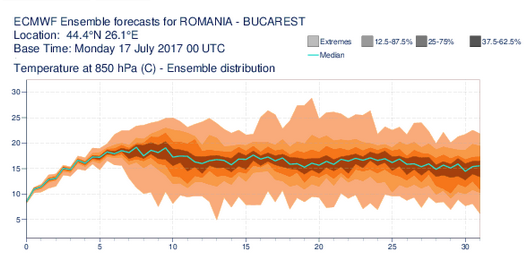
Page: Section 8.2.1 General use of extended-range output
|
|
PNG File Screenshot 2021-04-30 at 11.03.21.png |
90 kB |
Bob Owens |
Aug 23, 2022 16:49 |
Aug 23, 2022 16:49 |
|
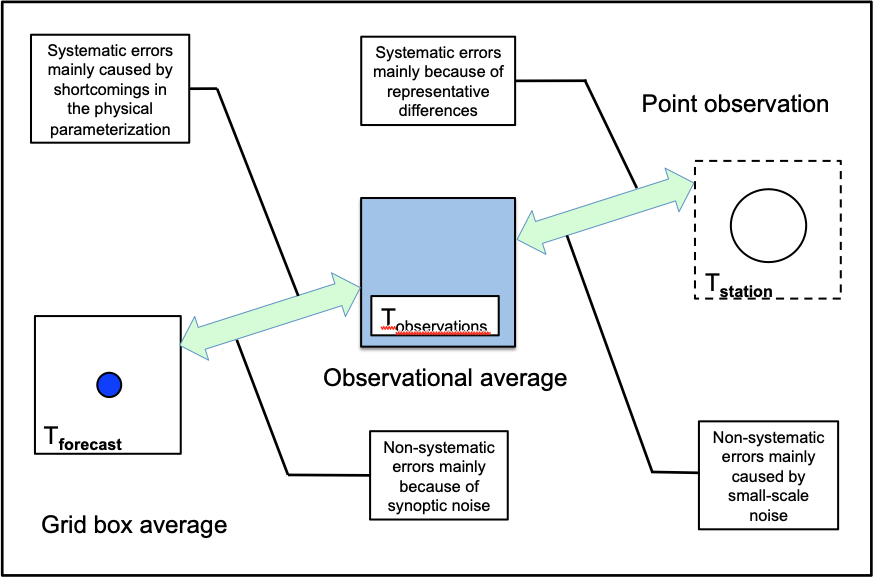
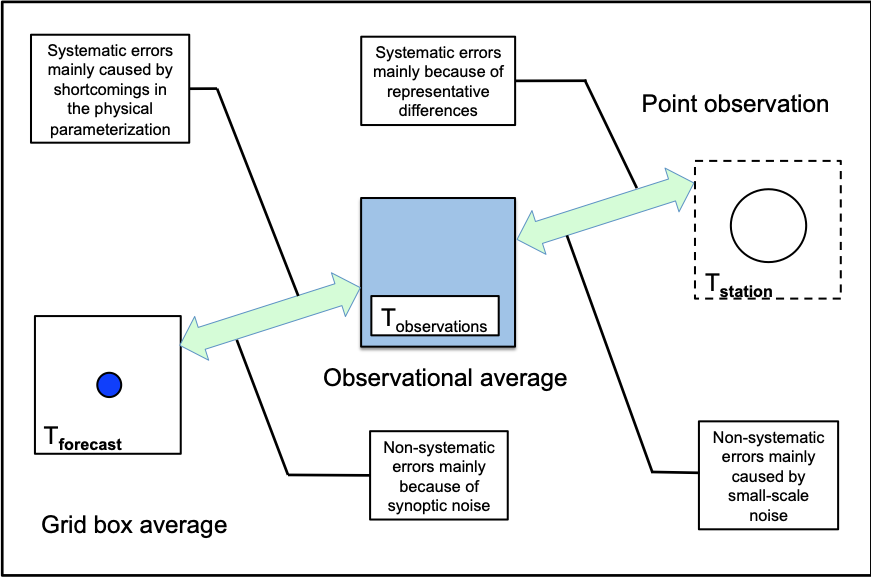
Page: Section 3.2 Grid Point Values and Observations
|
|
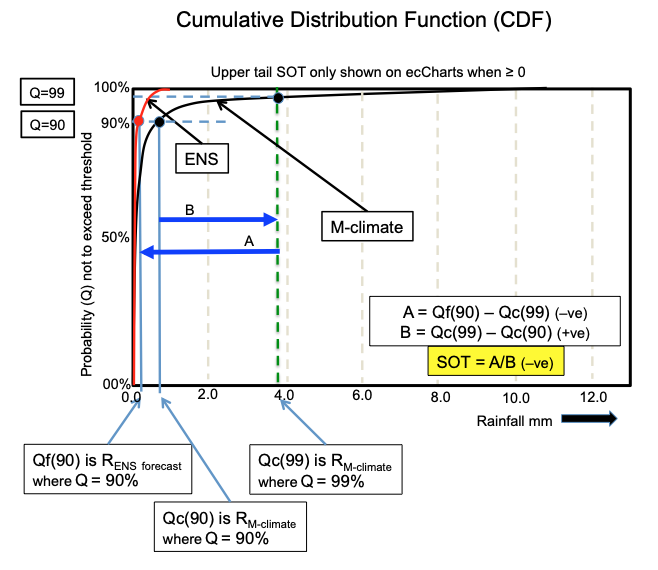
PNG File Screenshot 2020-12-21 at 16.52.26.png |
90 kB |
Bob Owens |
Aug 23, 2022 17:32 |
Aug 23, 2022 17:32 |
|
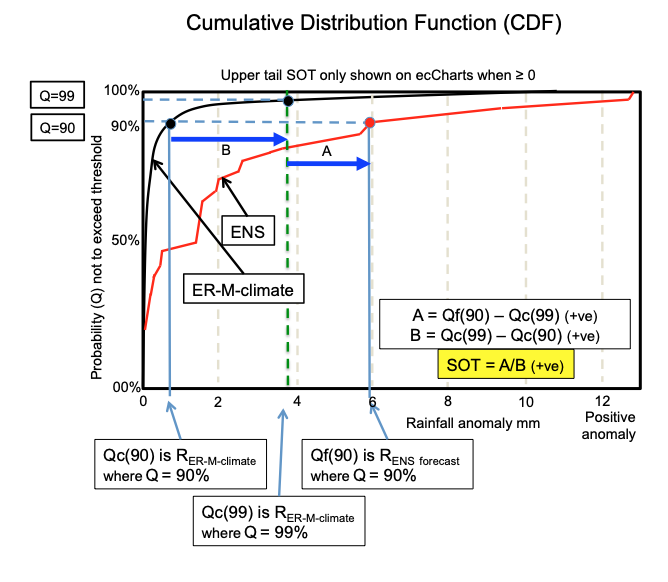
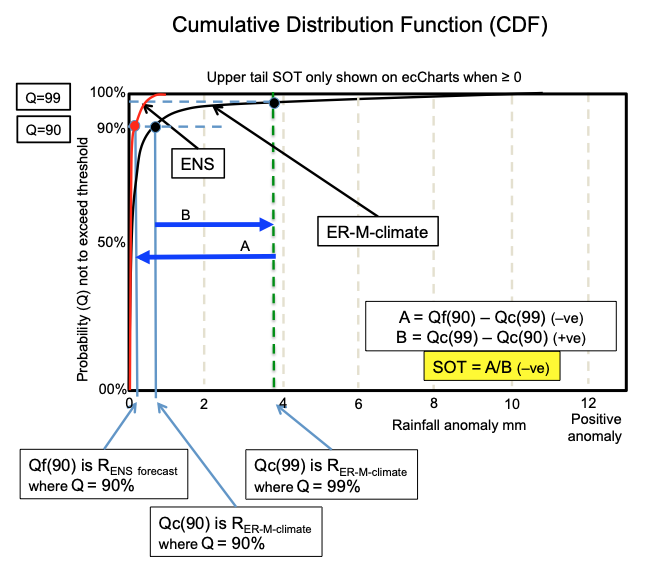
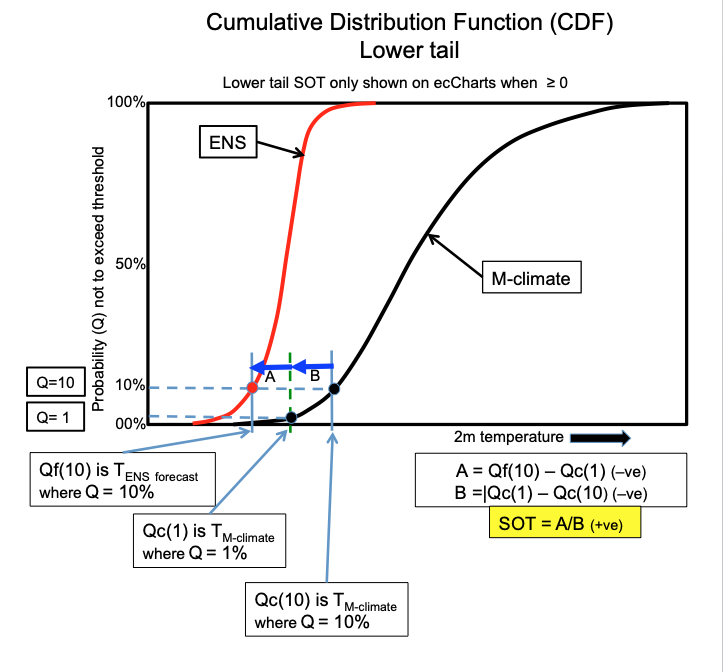
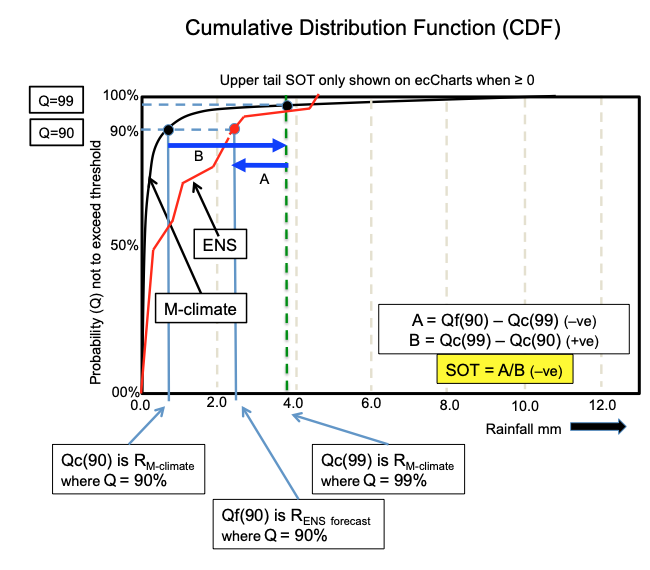
Page: Section 8.1.9.3 Calculating the Shift of Tails - SOT
|
|
PNG File CDF Lower Tail M +SOT.png |
90 kB |
Bob Owens |
Aug 23, 2022 17:32 |
Aug 23, 2022 17:32 |
|
Page: Section 8.1.9.3 Calculating the Shift of Tails - SOT
|
|
JPEG File ThinkstockPhotos-955736436-new.jpg |
89 kB |
Bob Owens |
Apr 01, 2024 20:10 |
Apr 01, 2024 20:10 |
|
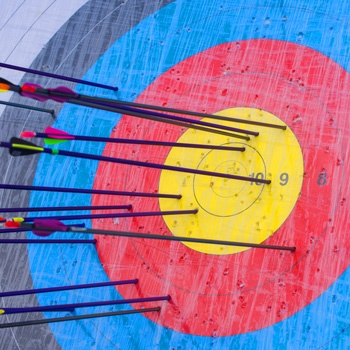
Page: Section 5 Forecast Ensemble (ENS) - Rationale and Construction
|
|
PNG File Fig8.12.25 Correlation with-without MJO.png |
89 kB |
Bob Owens |
Aug 25, 2022 09:56 |
Aug 25, 2022 09:56 |
|
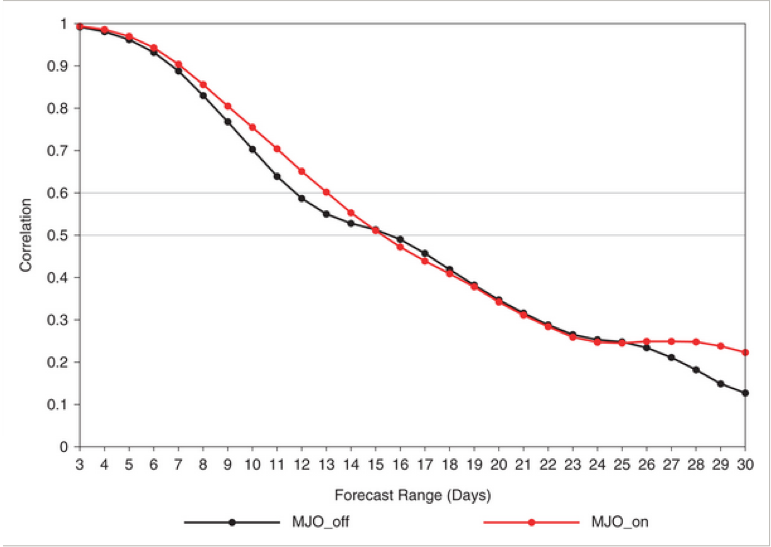
Page: Section 8.2.2 Circulation patterns or Regimes
|
|
PNG File Fig8.12.25 Correlation with-without MJO.png |
89 kB |
Bob Owens |
Oct 28, 2023 12:37 |
Oct 28, 2023 12:37 |
|
Page: Section 8.2.8 Teleconnections
|
|
PNG File Screenshot 2021-04-30 at 11.05.21.png |
89 kB |
Bob Owens |
Aug 23, 2022 16:49 |
Aug 23, 2022 16:49 |
|
Page: Section 3.2 Grid Point Values and Observations
|
|
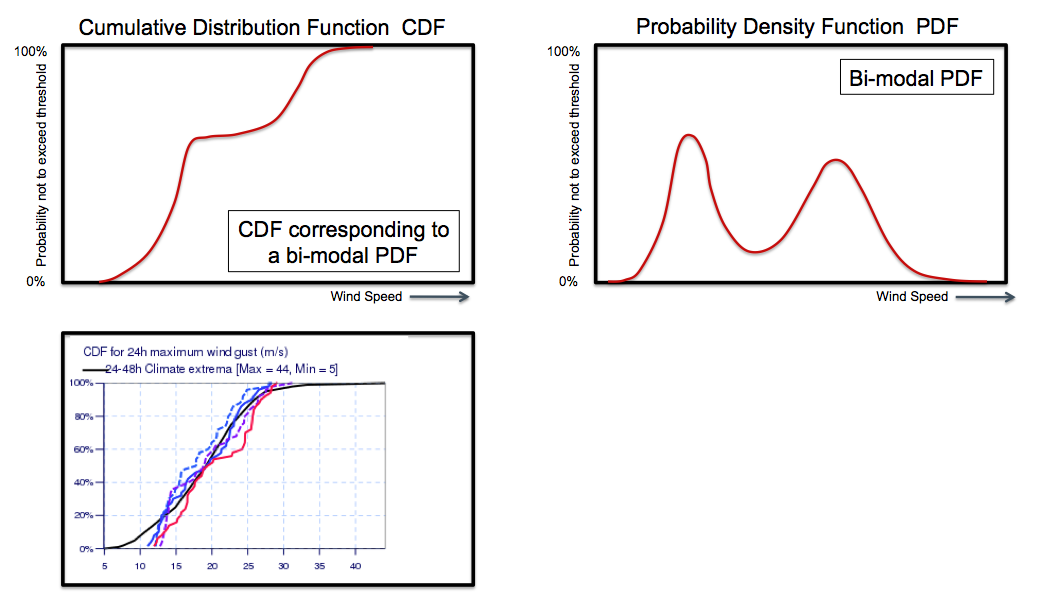
PNG File Fig8.7.4 Bi-modal CDF and PDF and example.png |
89 kB |
Bob Owens |
Aug 23, 2022 17:31 |
Aug 23, 2022 17:31 |
|
Page: Section 8.1.9.1 Cumulative Distribution Function, Probability Density Function
|
|
PNG File FigXZ4 Shift of Tails.png |
89 kB |
Bob Owens |
Aug 23, 2022 17:32 |
Aug 23, 2022 17:32 |
|
Page: Section 8.1.9.3 Calculating the Shift of Tails - SOT
|
|
PNG File Screenshot 2020-12-21 at 16.48.56.png |
89 kB |
Bob Owens |
Aug 23, 2022 17:32 |
Aug 23, 2022 17:32 |
|
Page: Section 8.1.9.3 Calculating the Shift of Tails - SOT
|
|
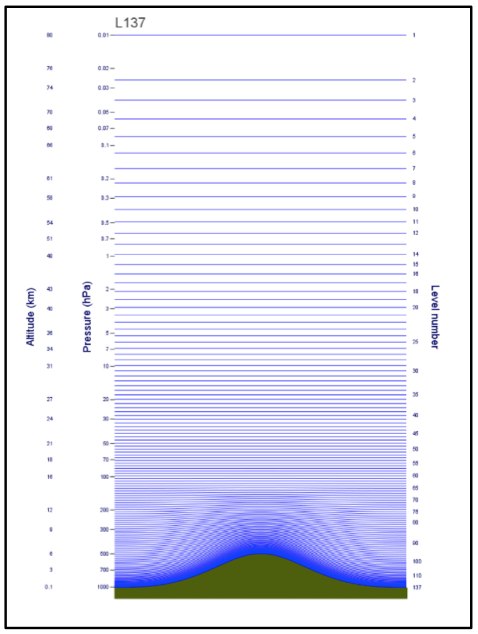
PNG File Screenshot 2021-05-23 at 19.54.33.png |
89 kB |
Bob Owens |
Sept 06, 2022 20:45 |
Sept 06, 2022 20:45 |
|
Page: Section 2.1.1.1 Grid point Resolution
|
|
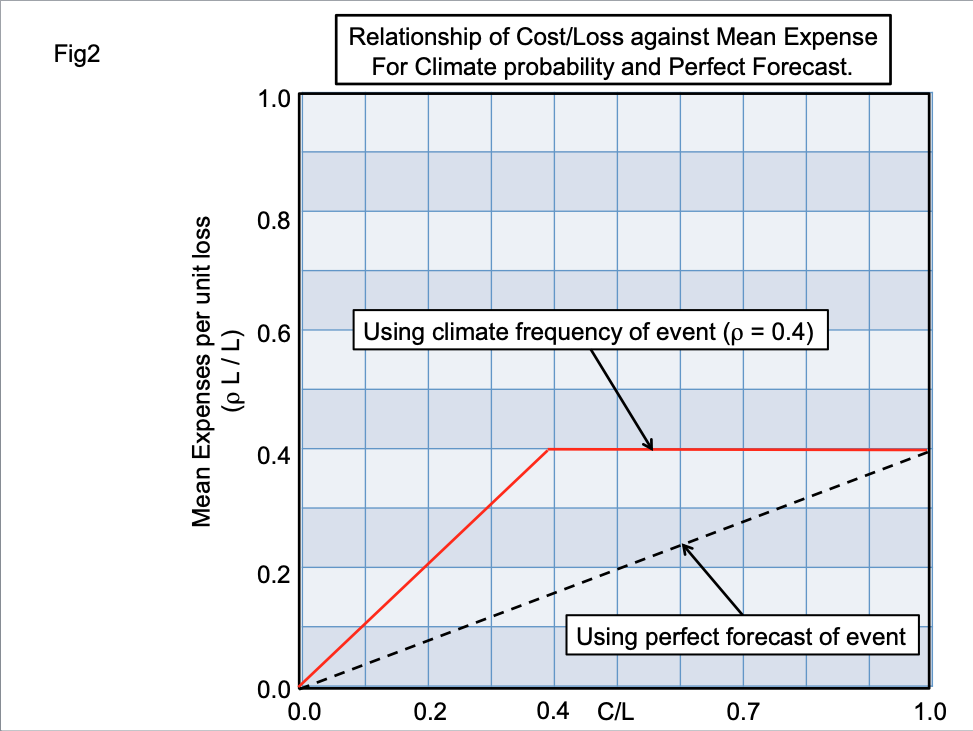
PNG File CostLossNo2.png |
89 kB |
Bob Owens |
Jul 06, 2023 09:24 |
Jul 06, 2023 09:24 |
|
Page: Section 12.B Statistical Concepts - Probabilistic Data
|
|
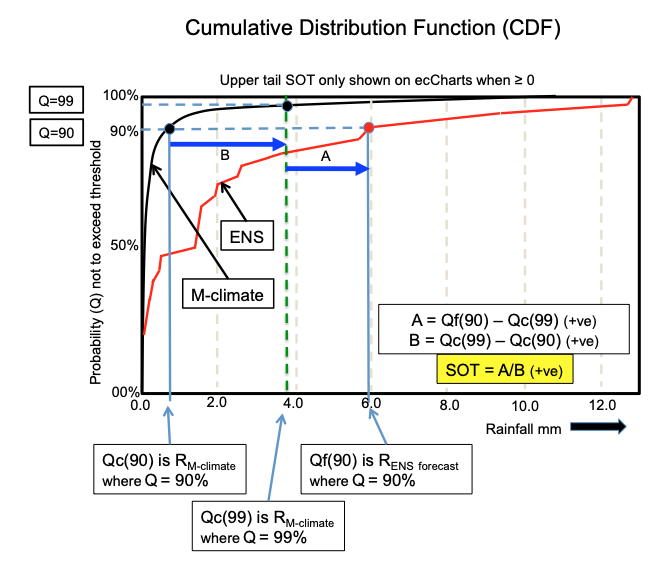
PNG File Screenshot 2020-12-21 at 17.09.28.png |
88 kB |
Bob Owens |
Aug 23, 2022 17:32 |
Aug 23, 2022 17:32 |
|
Page: Section 8.1.9.3 Calculating the Shift of Tails - SOT
|
|
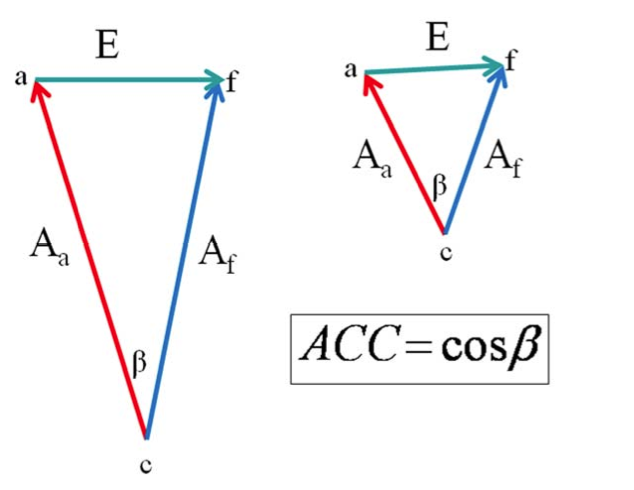
PNG File Fig10.A.12 ACC & RMSE conflicting Signals.png |
88 kB |
Bob Owens |
Jul 06, 2023 09:22 |
Jul 06, 2023 09:22 |
|
Page: Section 12.A Statistical Concepts - Deterministic Data
|
|
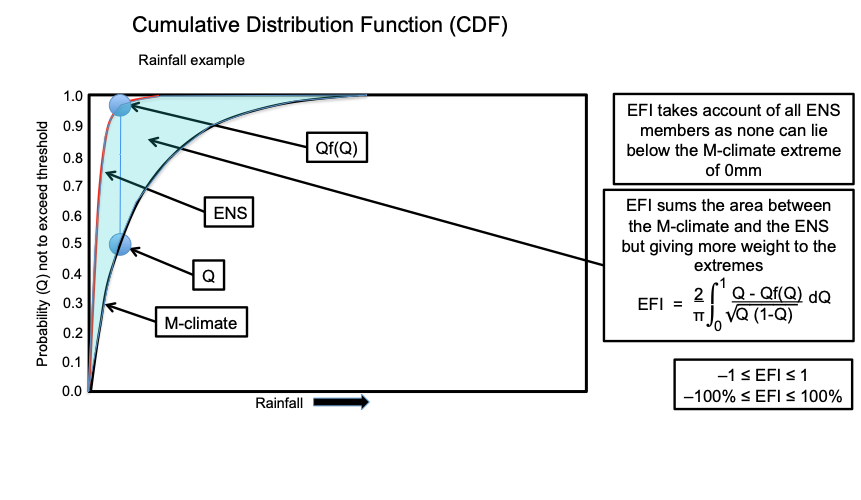
PNG File Screenshot 2020-12-21 at 12.45.42.png |
88 kB |
Bob Owens |
Aug 23, 2022 17:46 |
Aug 23, 2022 17:46 |
|
Page: Section 8.1.9.2 Extreme Forecast Index - EFI
|
|
PNG File Screenshot 2023-05-05 at 10.19.06.png |
88 kB |
Bob Owens |
May 05, 2023 10:22 |
May 05, 2023 10:22 |
|
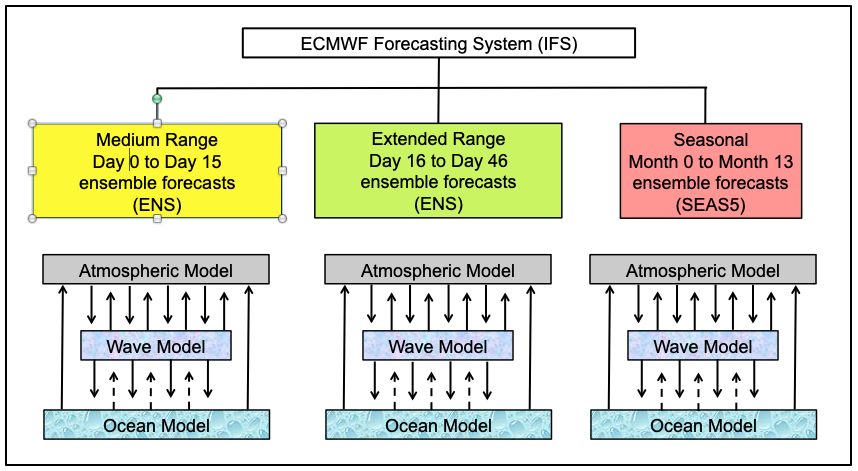
Page: Section 2 The ECMWF Integrated Forecasting System - IFS
|
|
PNG File Fig35.png |
88 kB |
Bob Owens |
Aug 23, 2022 17:16 |
Aug 23, 2022 17:16 |
|
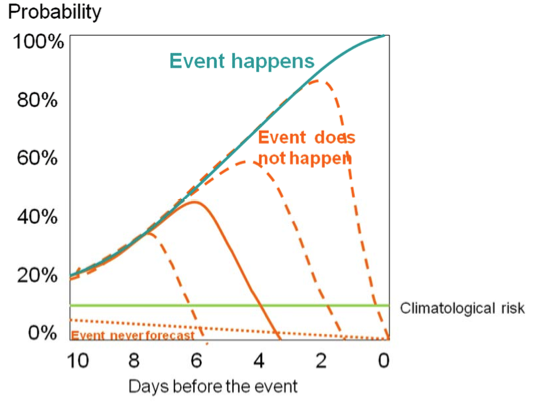
Page: Section 7.1 Consideration of Probability
|
|
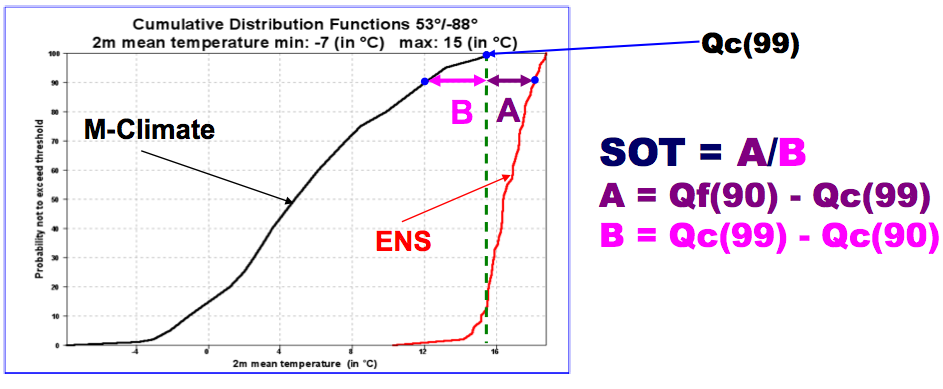
PNG File Screenshot 2020-12-21 at 16.49.49.png |
87 kB |
Bob Owens |
Aug 23, 2022 17:32 |
Aug 23, 2022 17:32 |
|
Page: Section 8.1.9.3 Calculating the Shift of Tails - SOT
|