| Name
|
Size
|
Creator |
Creation Date
|
Last Modification Date
|
Labels |
Attached To |
|
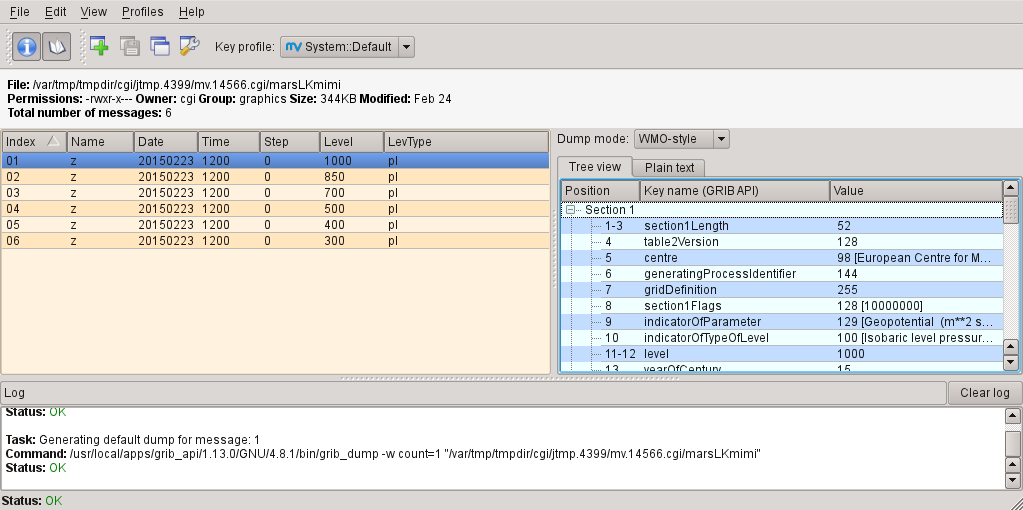
PNG File grib-examiner.png |
73 kB |
Iain Russell |
Feb 24, 2015 16:57 |
Feb 24, 2015 16:57 |
|
Page: Data Part 1
|
|
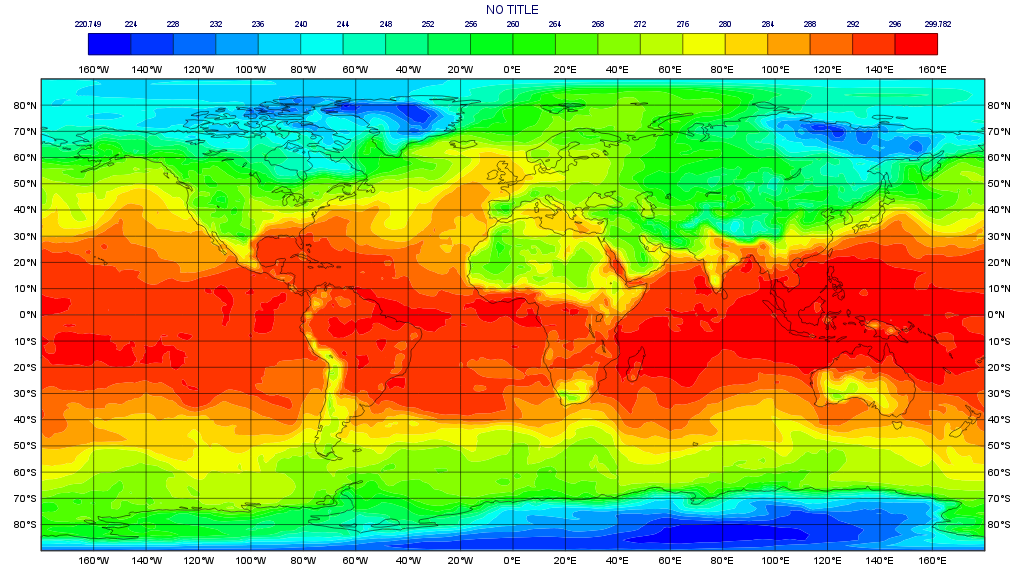
PNG File netcdf-visualiser-plot.png |
309 kB |
Iain Russell |
Feb 24, 2015 09:44 |
Feb 24, 2015 09:44 |
|
Page: Data Part 2
|
|
PNG File grib-to-geopoints.png |
274 kB |
Iain Russell |
Feb 24, 2015 07:58 |
Feb 24, 2015 07:58 |
|
Page: Processing Data
|
|
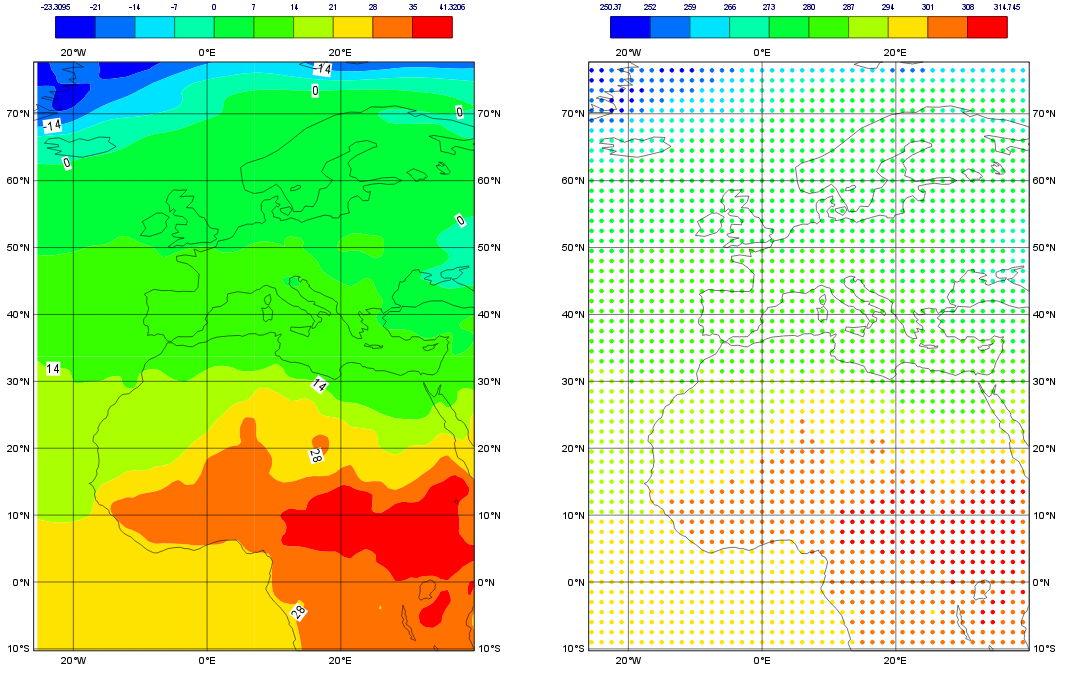
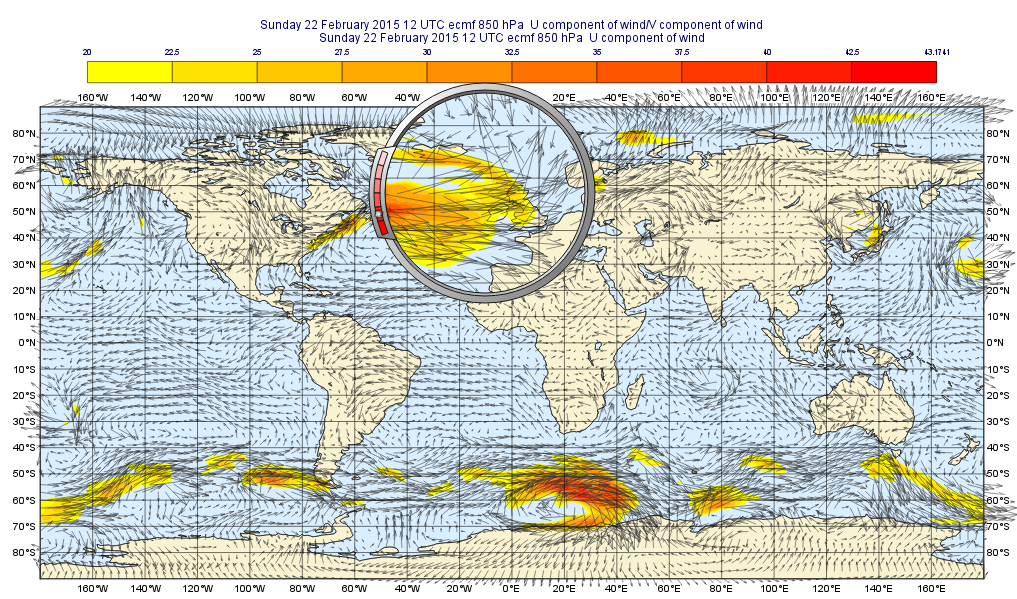
PNG File computed-wind-speed-plot.png |
828 kB |
Iain Russell |
Feb 23, 2015 16:26 |
Feb 23, 2015 16:26 |
|
Page: Processing Data
|
|
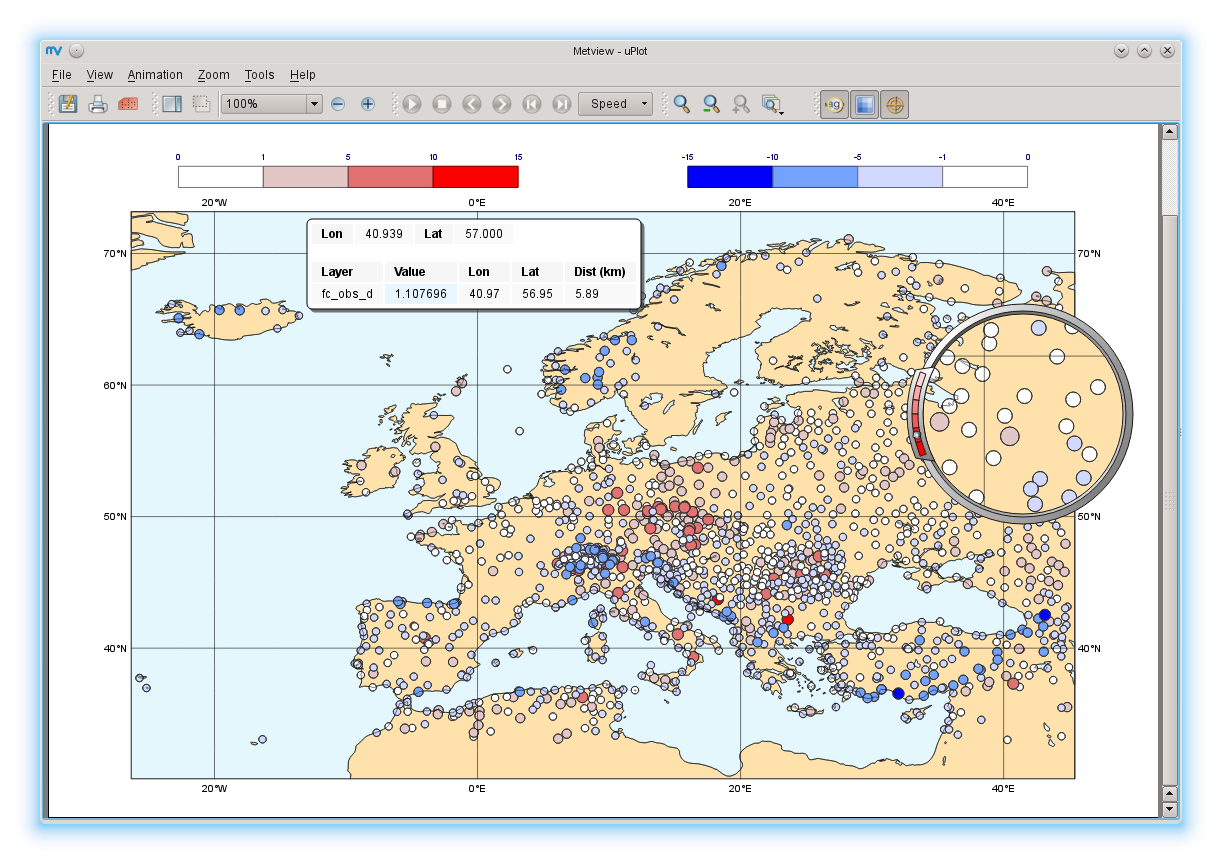
PNG File fc-obs-diff-plot.png |
417 kB |
Iain Russell |
Feb 23, 2015 15:32 |
Feb 23, 2015 15:32 |
|
Page: Processing Data
|
|
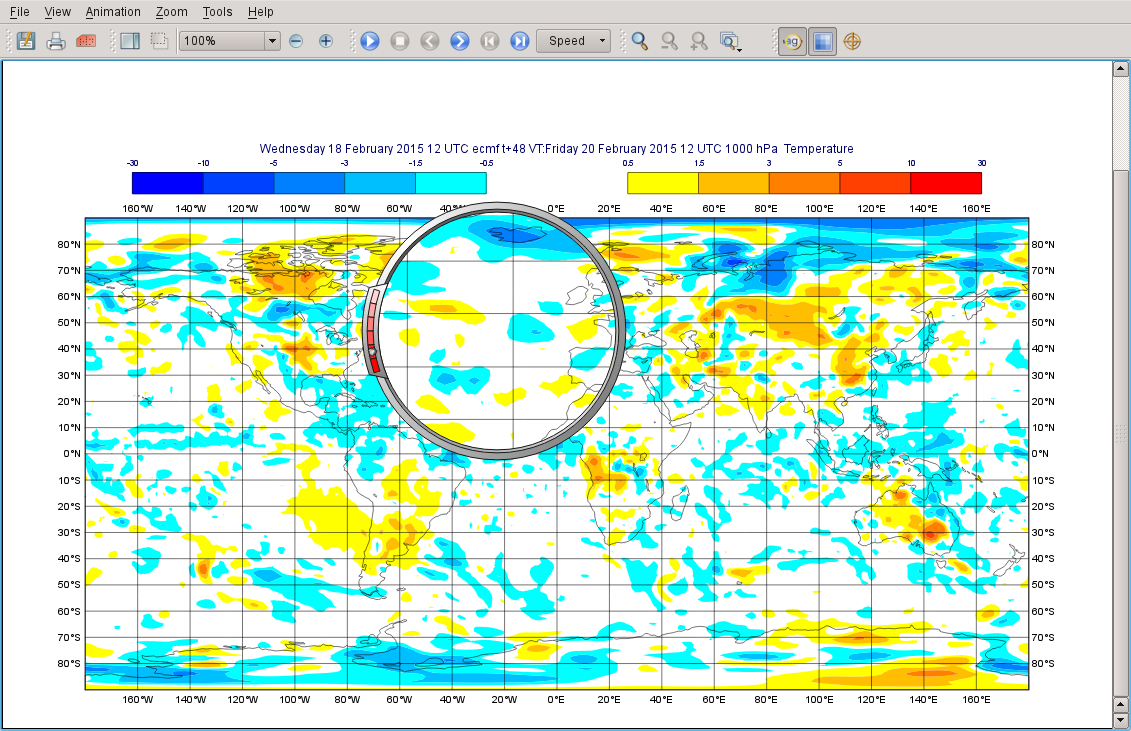
PNG File fc-an-diff-plot.png |
338 kB |
Iain Russell |
Feb 23, 2015 11:59 |
Feb 23, 2015 11:59 |
|
Page: Processing Data
|
|
PNG File fieldset-plus-fieldset.png |
10 kB |
Iain Russell |
Feb 23, 2015 10:59 |
Feb 23, 2015 10:59 |
|
Page: Processing Data
|
|
File fieldset-plus-fieldset |
9 kB |
Iain Russell |
Feb 23, 2015 10:59 |
Feb 23, 2015 10:59 |
|
Page: Processing Data
|
|
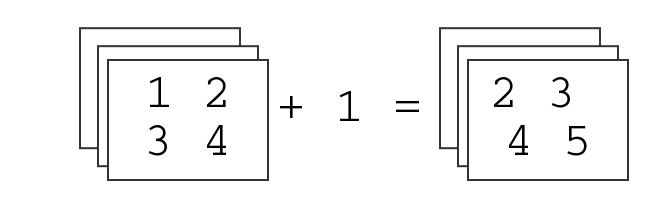
PNG File fieldset-plus-one.png |
6 kB |
Iain Russell |
Feb 23, 2015 10:57 |
Feb 23, 2015 10:57 |
|
Page: Processing Data
|
|
File fieldset-plus-one |
6 kB |
Iain Russell |
Feb 23, 2015 10:57 |
Feb 23, 2015 10:57 |
|
Page: Processing Data
|
|
PNG File metview-fieldset-plus-one.png |
9 kB |
Iain Russell |
Feb 23, 2015 10:49 |
Feb 23, 2015 10:49 |
|
Page: Processing Data
|
|
File metview-fieldset-plus-one |
7 kB |
Iain Russell |
Feb 23, 2015 10:49 |
Feb 23, 2015 10:49 |
|
Page: Processing Data
|
|
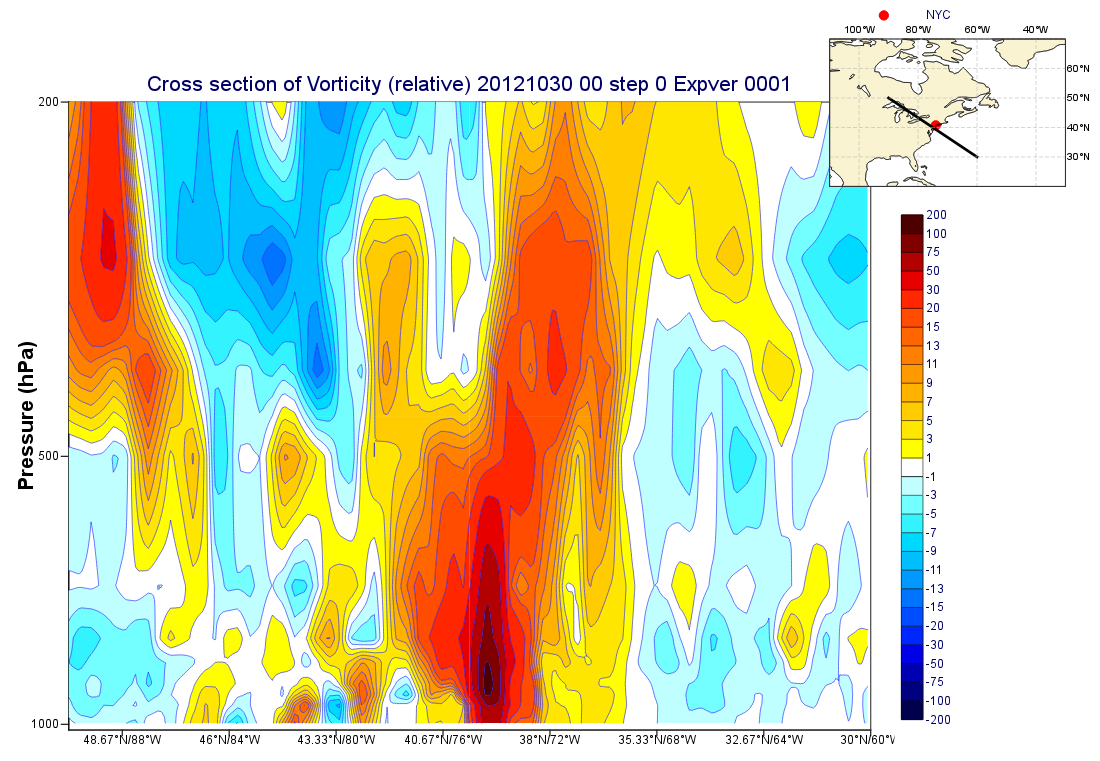
PNG File sandy-xs-with-map.png |
363 kB |
Iain Russell |
Feb 20, 2015 17:15 |
Feb 20, 2015 17:15 |
|
Page: Case Study: Cross Section of Sandy
|
|
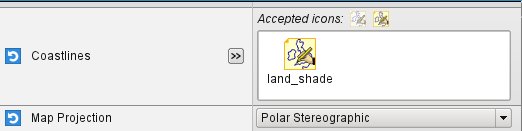
PNG File embedded-coastlines-icon.png |
10 kB |
Iain Russell |
Feb 20, 2015 14:07 |
Feb 20, 2015 14:07 |
|
Page: A Quick Tour of Metview
|
|
PNG File image2015-2-20 12:9:57.png |
121 kB |
Sandor Kertesz |
Feb 20, 2015 12:09 |
Feb 20, 2015 12:09 |
|
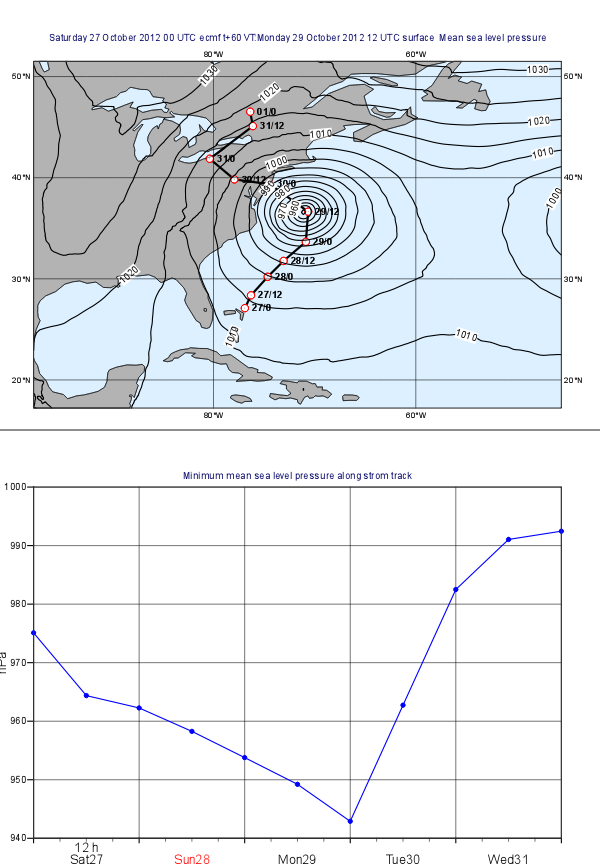
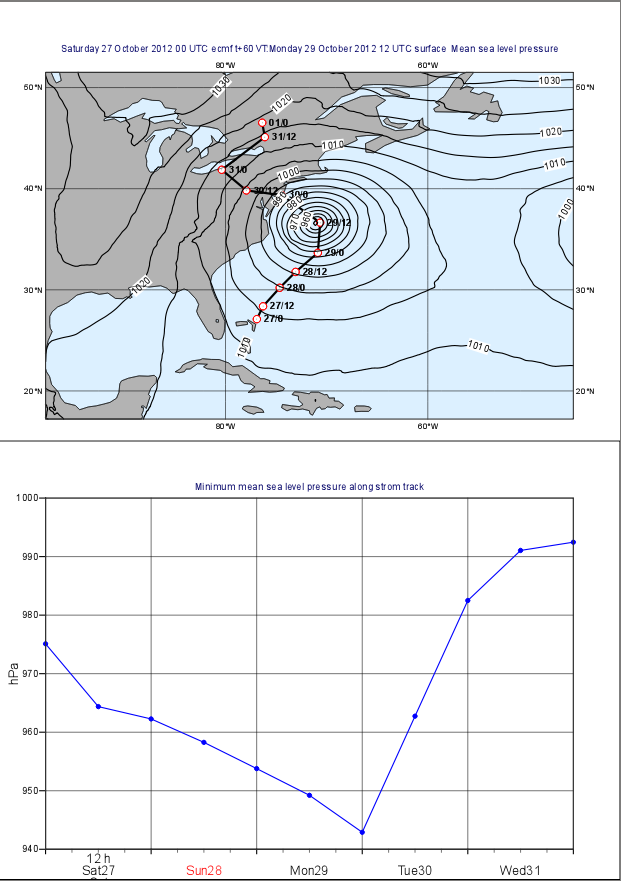
Page: Case study: Plotting the Track of Hurricane Sandy
|
|
PNG File image2015-2-20 12:9:20.png |
122 kB |
Sandor Kertesz |
Feb 20, 2015 12:09 |
Feb 20, 2015 12:09 |
|
Page: Case study: Plotting the Track of Hurricane Sandy
|
|
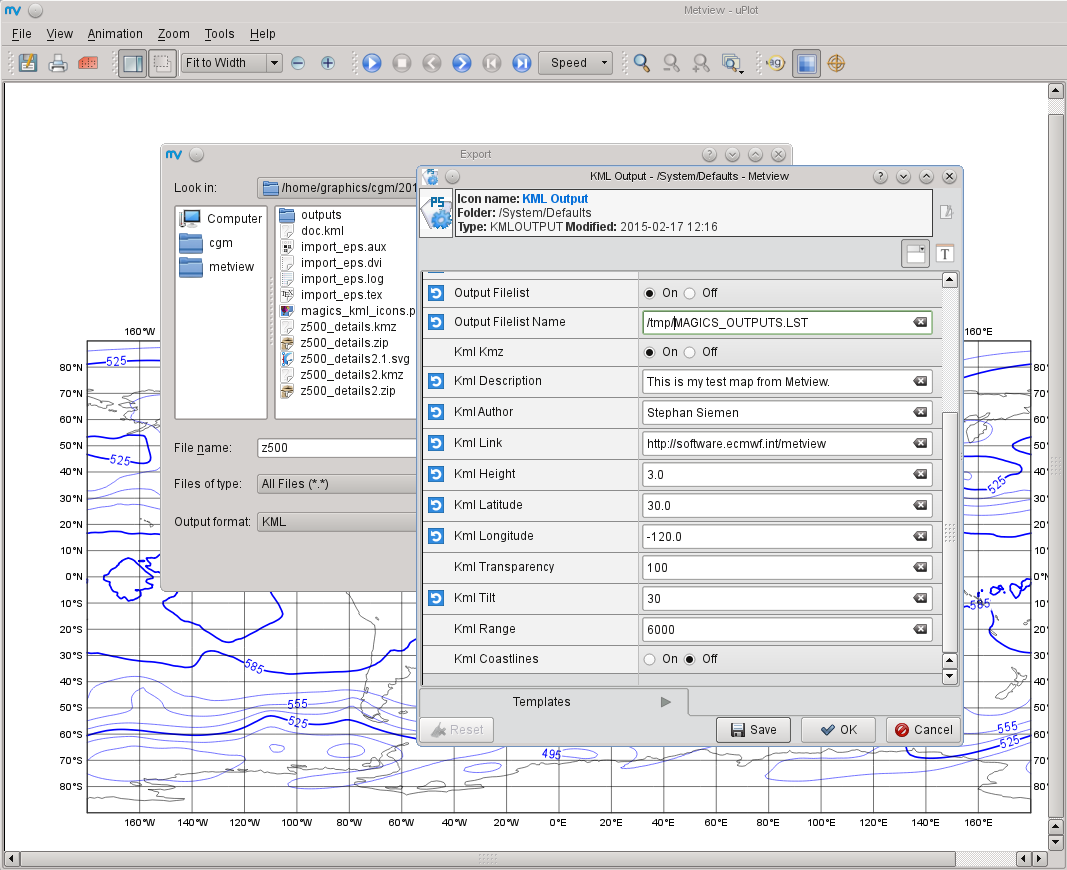
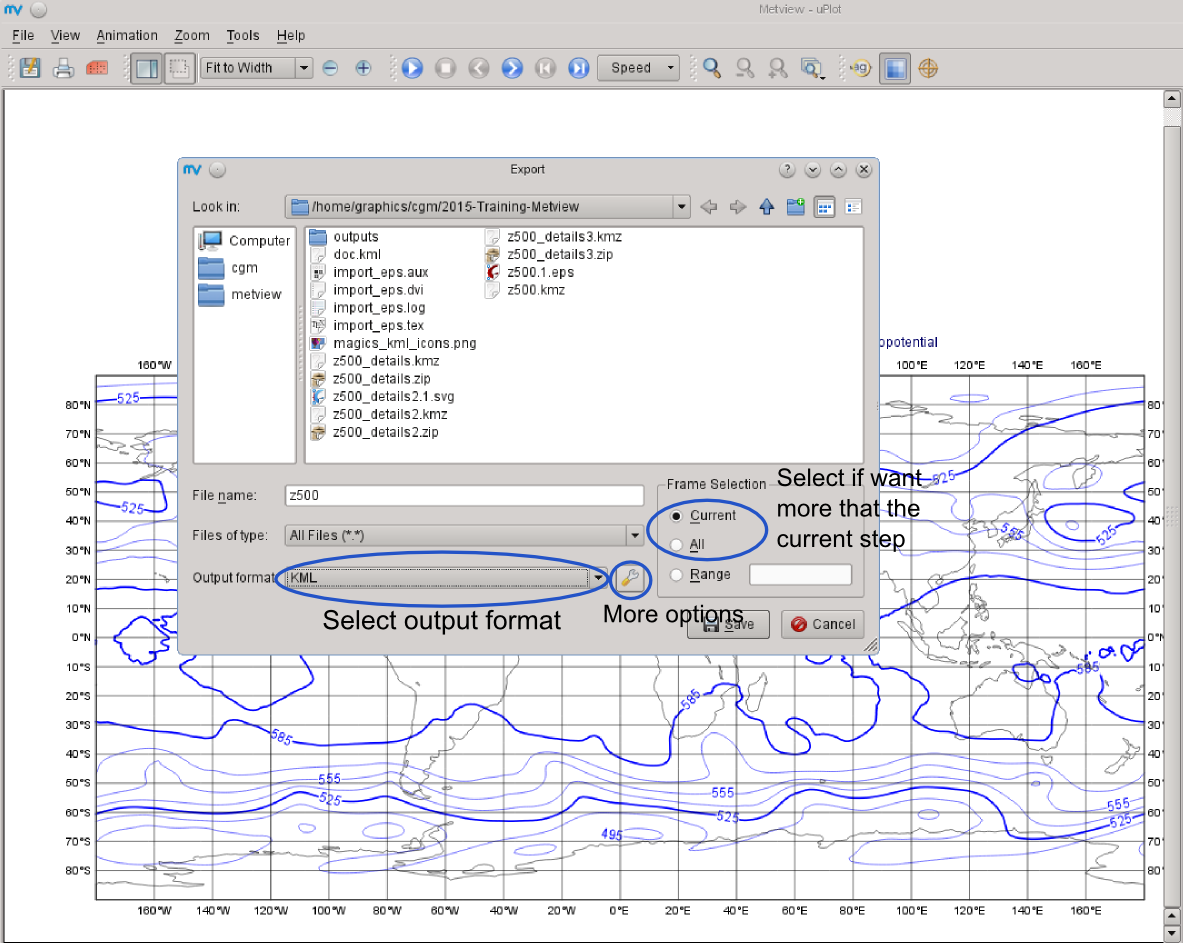
PNG File 2015-Metview-ExportDialogeOptions.png |
184 kB |
Stephan Siemen |
Feb 20, 2015 10:40 |
Feb 20, 2015 10:40 |
|
Page: Working with graphical output
|
|
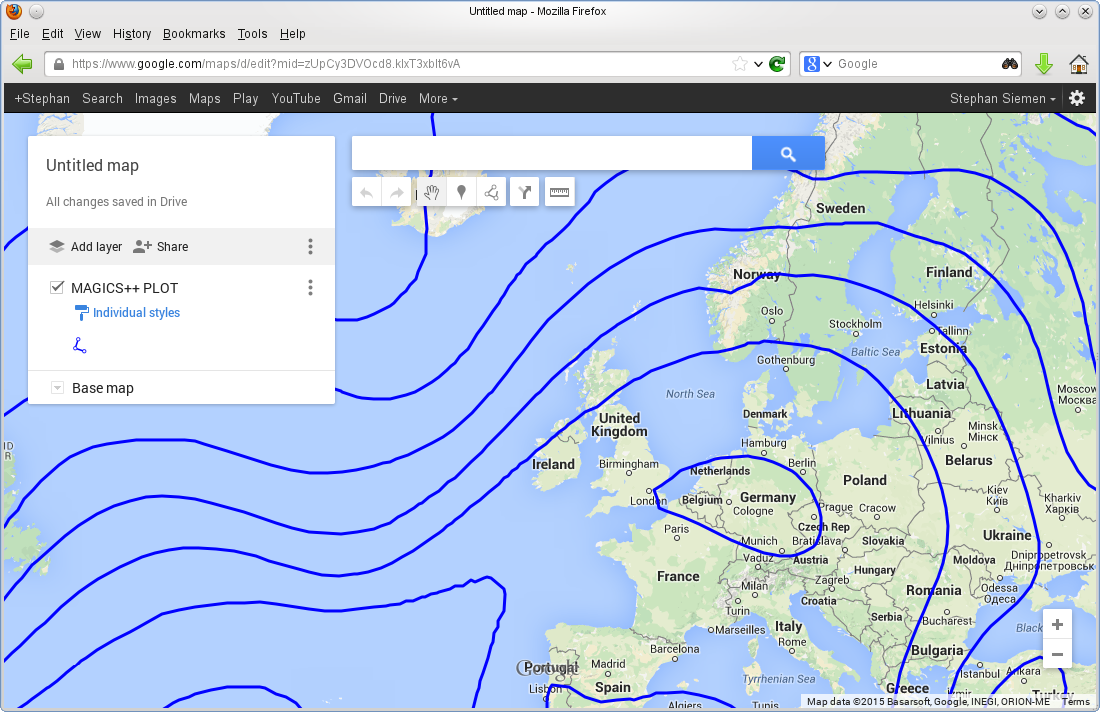
PNG File 2015-Metview-KML-GoogleMaps.png |
431 kB |
Stephan Siemen |
Feb 20, 2015 10:35 |
Feb 20, 2015 10:35 |
|
Page: Working with graphical output
|
|
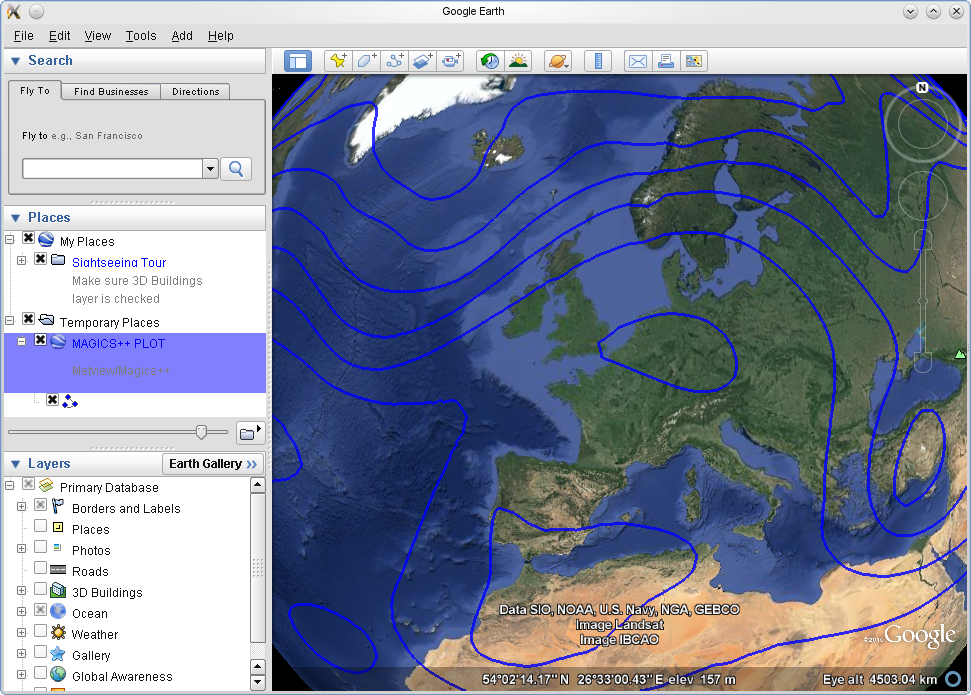
PNG File 2015-Metview-KML-GoogleEarth.png |
774 kB |
Stephan Siemen |
Feb 20, 2015 10:35 |
Feb 20, 2015 10:35 |
|
Page: Working with graphical output
|
|
PNG File 2015-Metview-ExportDialoge_edited.png |
330 kB |
Stephan Siemen |
Feb 20, 2015 10:35 |
Feb 20, 2015 10:35 |
|
Page: Working with graphical output
|