| Name
|
Size
|
Creator |
Creation Date
|
Last Modification Date
|
Labels |
Attached To |
|
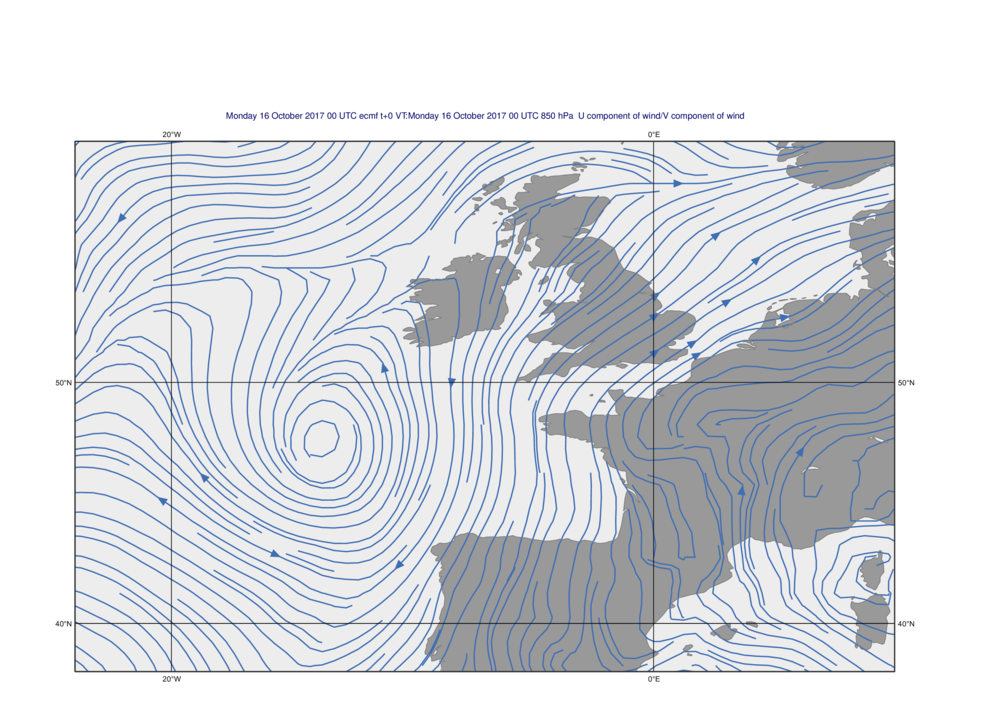
PNG File streamline.png |
1.26 MB |
Sandor Kertesz |
Feb 22, 2019 09:40 |
Feb 22, 2019 09:40 |
|
Page: Latest News
|
|
PNG File streamline.png |
1.26 MB |
Sandor Kertesz |
Feb 21, 2019 13:45 |
Feb 21, 2019 13:45 |
|
Page: Gallery
|
|
File processing data.tar.gz |
1.26 MB |
Iain Russell |
Mar 19, 2015 13:23 |
Mar 19, 2015 13:23 |
|
Page: Processing Data
|
|
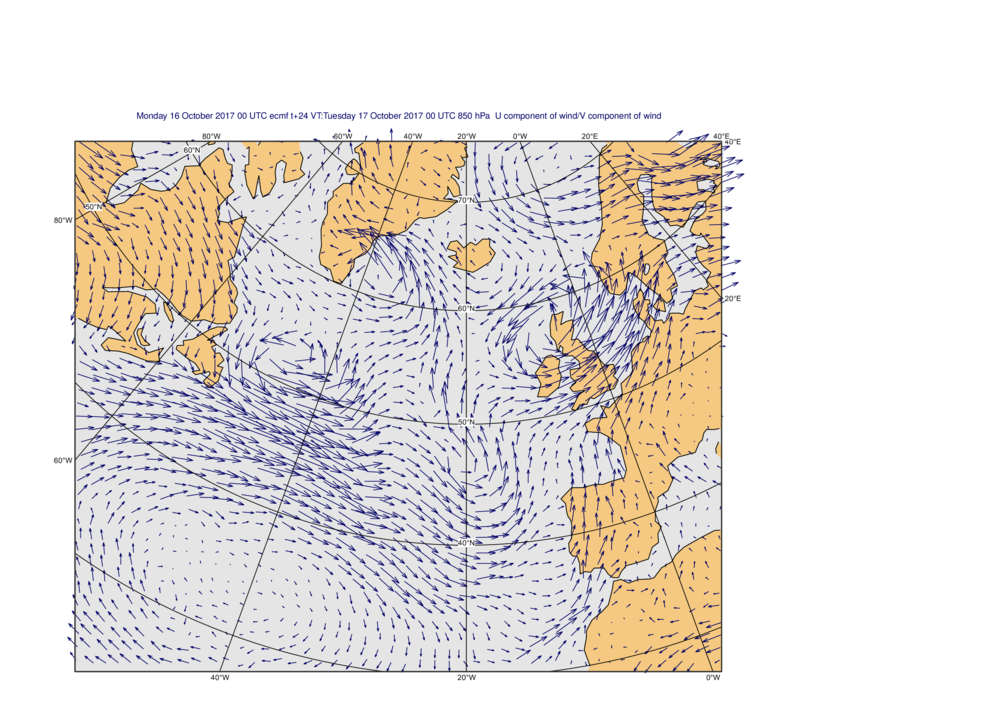
PNG File wind_from_spectral_div_and_vor.png |
1.25 MB |
Sandor Kertesz |
Mar 24, 2021 09:08 |
Mar 24, 2021 09:08 |
|
Page: Gallery
|
|
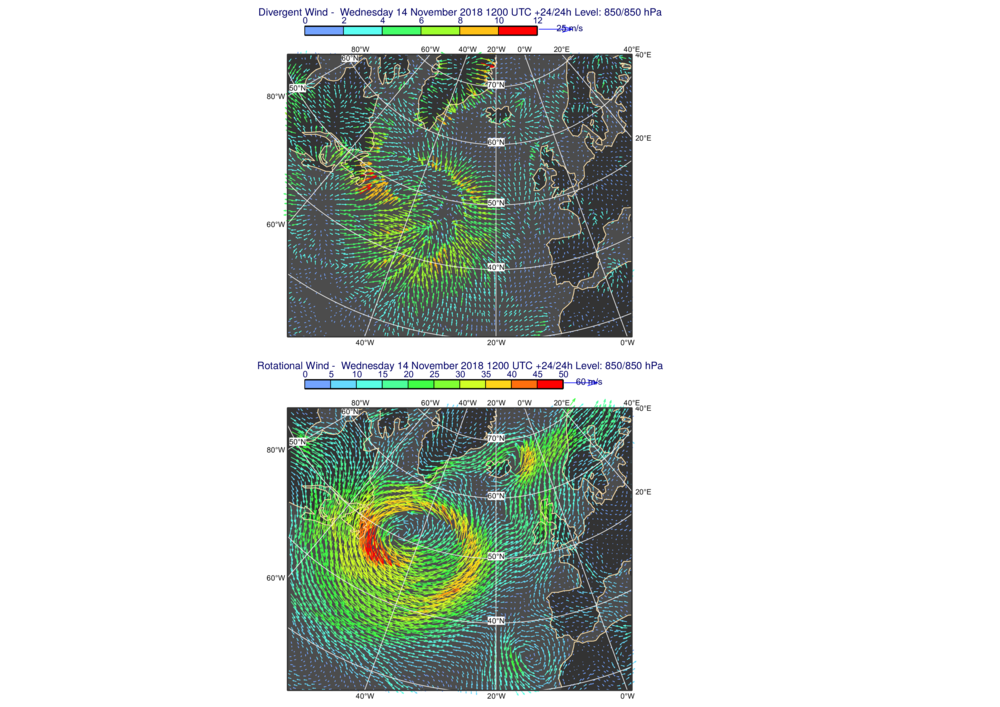
PNG File divergent_and_rotational_wind.png |
1.22 MB |
Sandor Kertesz |
Mar 24, 2021 09:09 |
Mar 24, 2021 09:09 |
|
Page: Gallery
|
|
ZIP Archive shape_file_layer.tar.gz |
1.20 MB |
Sandor Kertesz |
Mar 24, 2021 10:55 |
Mar 24, 2021 10:55 |
|
Page: Custom Shapefile Map Layer with Major River Basins Example
|
|
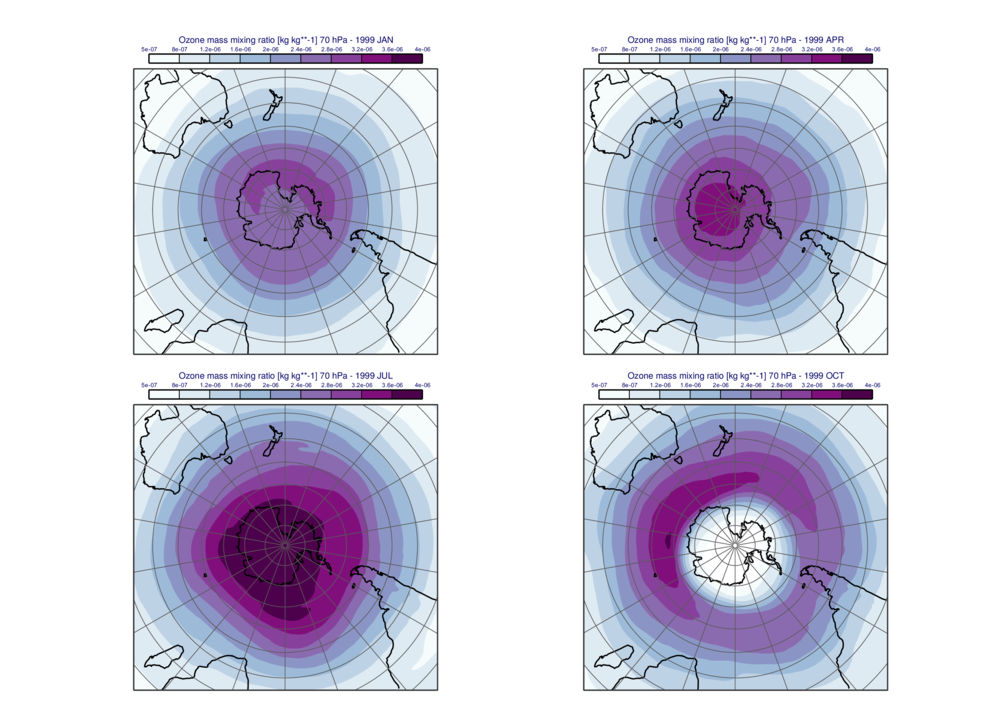
PNG File nc_era5_ozone.png |
1.19 MB |
Sandor Kertesz |
Jul 22, 2019 11:16 |
Jul 22, 2019 11:16 |
|
Page: Gallery
|
|
ZIP Archive zonal_average.tar.gz |
1.10 MB |
Sandor Kertesz |
May 22, 2019 09:25 |
May 22, 2019 09:25 |
|
Page: Zonal Average Example
|
|
ZIP Archive meridional_average.tar.gz |
1.10 MB |
Sandor Kertesz |
May 22, 2019 09:25 |
May 22, 2019 09:25 |
|
Page: Meridional Average Example
|
|
PNG File gradient_shading.png |
1.09 MB |
Sandor Kertesz |
Aug 24, 2020 13:08 |
Aug 24, 2020 13:08 |
|
Page: Gallery
|
|
PDF File mv_macro.pdf |
1.08 MB |
Iain Russell |
May 02, 2014 08:30 |
May 02, 2014 08:30 |
|
Page: Tutorials
|
|
PNG File rainbow_contour_diffs.png |
1.06 MB |
Sandor Kertesz |
Oct 21, 2020 16:48 |
Oct 21, 2020 16:48 |
|
Page: Gallery
|
|
ZIP Archive graph.tar.gz |
1.05 MB |
Iain Russell |
Sept 16, 2016 13:50 |
Sept 16, 2016 13:50 |
|
Page: Graph Plotting in Metview
|
|
ZIP Archive macro_tutorial_icons.zip |
1.03 MB |
Iain Russell |
May 02, 2014 08:31 |
May 02, 2014 08:31 |
|
Page: Tutorials
|
|
ZIP Archive ens_tephigram.tar.gz |
1.02 MB |
Sandor Kertesz |
Oct 14, 2020 16:30 |
Oct 14, 2020 16:30 |
|
Page: ENS Tephigram Example
|
|
PNG File layoutx3.png |
1.00 MB |
Iain Russell |
Sept 26, 2018 14:45 |
Sept 26, 2018 14:45 |
|
Page: Gallery
|
|
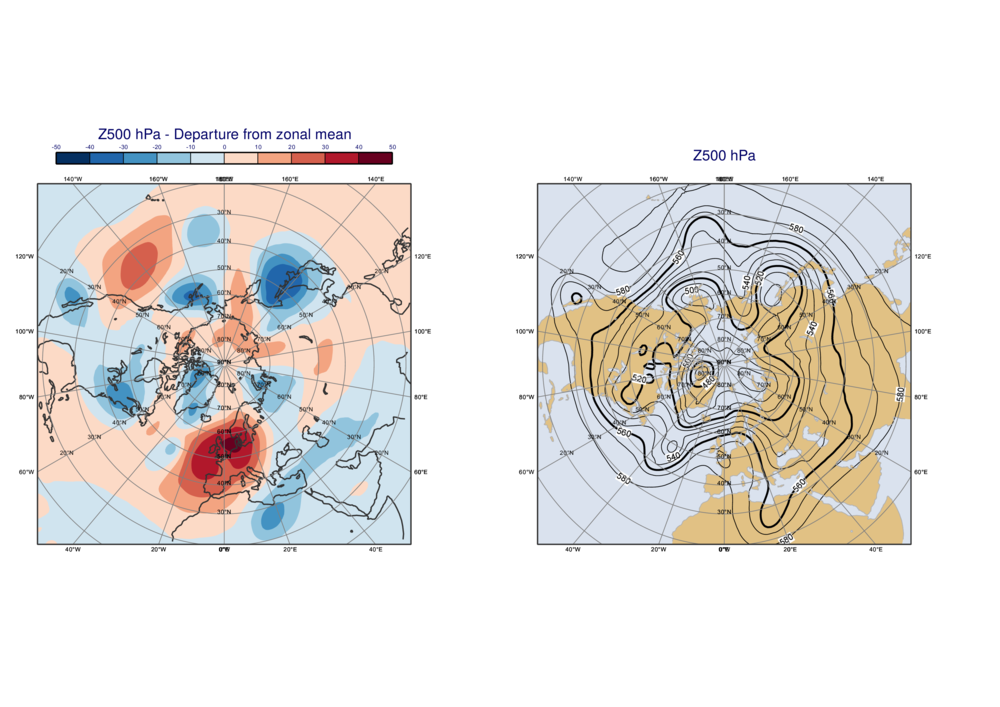
PNG File departure_from_zonal_mean.png |
1012 kB |
Sandor Kertesz |
Mar 24, 2021 09:10 |
Mar 24, 2021 09:10 |
|
Page: Gallery
|
|
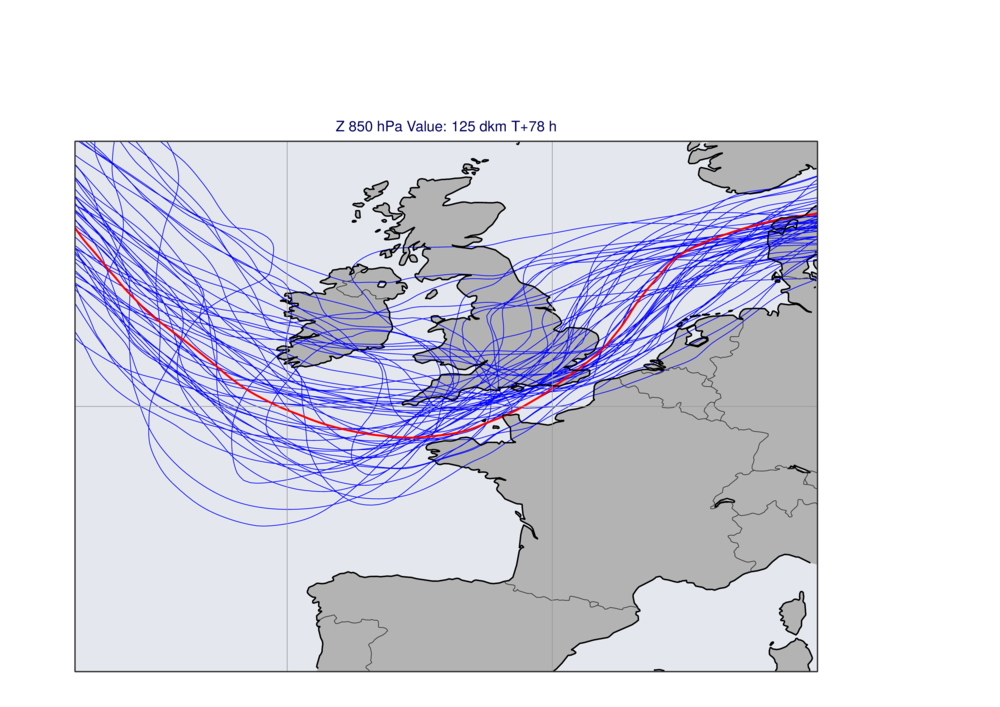
PNG File image.png |
1002 kB |
Fernando Ii |
Jun 19, 2020 14:26 |
Jun 19, 2020 14:26 |
|
Page: ENS Spaghetti Map Example
|
|
PDF File metview-batch-2016.pdf |
991 kB |
Iain Russell |
Sept 30, 2016 14:36 |
Sept 30, 2016 14:36 |
|
Page: Data analysis and visualisation using Metview
|
|
ZIP Archive wind_coloured_by_t.tar.gz |
987 kB |
Sandor Kertesz |
Oct 21, 2020 16:48 |
Oct 21, 2020 16:48 |
|
Page: Wind Coloured By Temperature Example
|