-
Created by
 Paul Berrisford, last updated by Michela Giusti on Jul 16, 2024
8 minute read
Paul Berrisford, last updated by Michela Giusti on Jul 16, 2024
8 minute read
A few times per year, the analysed low-level winds, e.g. the 10m winds, become unrealistically large in a particular location, which varies amongst a few apparently preferred locations. The largest values seen so far are about 300 ms-1. This problem occurs towards the end of the data assimilation windows (9-21 UTC and 21-9 UTC) because of an instability in the analysis method. On occasion, erroneously large wind values are also present in the 100m winds.
From 19 February 2020 onwards, the ERA5 system has examined the 10m wind components and if the magnitude of either component exceeds 50 ms-1, then the analysed parameters are replaced with the "4v" parameters. These latter parameters are similar to the analysed ones, but don't usually suffer from such large values. For more information on 4v and data assimilation, see "Part II Data Assimilation" of the IFS documentation (CY41R2 for ERA5).
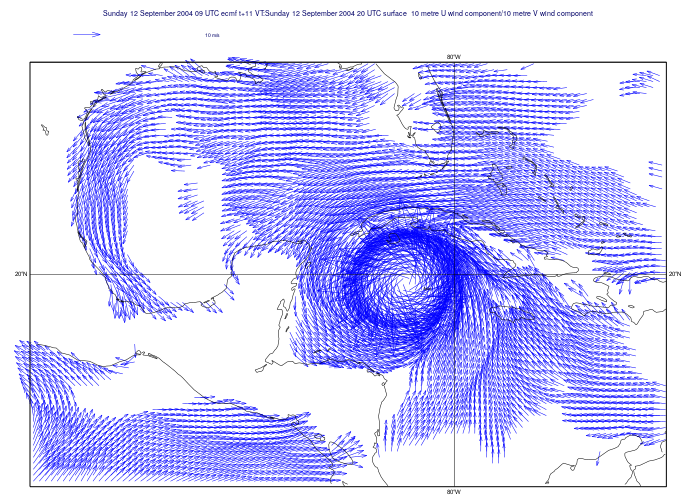
The choice of a 50 ms-1 cut off is an arbitrary one, which could miss spurious values that are less than 50 ms-1. This may well occur in the one or two hours just before the critical value of 50 ms-1 is reached. It is also possible that this cut off point could penalise realistic winds, such as in hurricanes. However, given the spatial resolution of ERA5 data (with a grid spacing of 31km), it is thought that in general, 10m wind components higher than 50 ms-1 are not realistic in ERA5, even if the observed magnitude is higher. This is illustrated in Fig. 1 for Hurricane Ivan in the Caribbean on 12 September 2004 at 20 UTC, where the analysed winds are compared with the 4v winds. The minimum value of the analysed 10 metre V wind components is -53 ms-1 (see Event 57, Table 2), while the minimum value of the 4v 10 metre V wind components is -29 ms-1. Even though the analysed wind speeds are not as large as the observed ones (the estimated peak wind speeds for Ivan were of order 70 ms-1), the 4v winds are thought to give a more realistic representation of the winds, for this resolution.
| Fig. 1a | Fig. 1b |
|---|---|
|
|
| Fig. 1a: The analysed 10m winds for 12 September 2004, 20 UTC, featuring Hurricane Ivan. The regional plot domain shows the Caribbean and Gulf of Mexico. | Fig. 1b: As Fig 1a, but for the 4v 10m winds. |

For dates before this system check was introduced into ERA5 (i.e. for the period January 1979 to 18 February 2020), the two tables below give details when the analysed 10m wind components (the 10 metre U wind component and 10 metre V wind component) exceed 50 ms-1. The CDS API script below can be used to retrieve the "4v" 10m wind components, which don't usually suffer from this large wind problem.
Table 1: Occurrences when the 10 metre U wind component exceeds 50 ms-1.
| Event | Date | Time | Latitude | Longitude | 10m U |
|---|---|---|---|---|---|
| 1 | 19790417 | 900 | -74.051 | 164.160 | 7.2323150635e+01 |
| 2 | 19800330 | 700 | -1.827 | 280.406 | -5.9812698364e+01 |
| 3 | 19800330 | 800 | -1.827 | 280.406 | -9.8439865112e+01 |
| 4 | 19800330 | 900 | -1.827 | 280.406 | -7.1381820679e+01 |
| 5 | 19820908 | 700 | -74.051 | 164.160 | -6.9596405029e+01 |
| 6 | 19820908 | 800 | -74.051 | 164.160 | -5.2189117432e+01 |
| 7 | 19821024 | 2100 | -74.051 | 164.160 | -1.5377770996e+02 |
| 8 | 19841004 | 700 | -74.051 | 164.160 | -5.5174591064e+01 |
| 9 | 19841004 | 800 | -74.051 | 164.160 | -6.8660507202e+01 |
| 10 | 19841004 | 900 | -74.051 | 165.120 | -7.1647964478e+01 |
| 11 | 19860724 | 800 | -74.051 | 164.160 | -8.8280364990e+01 |
| 12 | 19860724 | 900 | -74.051 | 164.160 | -2.9203100586e+02 |
| 13 | 19871016 | 2000 | -74.051 | 164.160 | -9.4200180054e+01 |
| 14 | 19871016 | 2100 | -74.051 | 164.160 | -1.5219485474e+02 |
| 15 | 19890711 | 2100 | 38.080 | 78.333 | 7.0804840088e+01 |
| 16 | 19890912 | 800 | -74.051 | 164.160 | -8.3815658569e+01 |
| 17 | 19890912 | 900 | -74.051 | 164.160 | -1.6730293274e+02 |
| 18 | 19900402 | 700 | -74.051 | 164.160 | 5.8469223022e+01 |
| 19 | 19930624 | 600 | -74.051 | 164.160 | 6.0172592163e+01 |
| 20 | 19930624 | 700 | -74.051 | 164.160 | 1.0357415771e+02 |
| 21 | 19930624 | 800 | -74.051 | 164.160 | 7.8659744263e+01 |
| 22 | 19930624 | 900 | -74.051 | 164.160 | 5.5145812988e+01 |
| 23 | 19930705 | 2000 | 38.080 | 78.333 | 8.0320663452e+01 |
| 24 | 19930705 | 2100 | 38.361 | 78.398 | 5.9963912964e+01 |
| 25 | 19940914 | 2100 | -74.051 | 164.160 | -7.9331817627e+01 |
| 26 | 19970607 | 700 | -74.051 | 164.160 | 5.8002792358e+01 |
| 27 | 19970607 | 800 | -74.051 | 164.160 | 1.0099096680e+02 |
| 28 | 19970923 | 1900 | -74.051 | 164.160 | 1.3710269165e+02 |
| 29 | 20010423 | 2100 | -74.051 | 164.160 | -8.0685379028e+01 |
| 30 | 20040327 | 800 | -74.051 | 164.160 | -6.4567825317e+01 |
| 31 | 20050314 | 800 | -1.827 | 280.406 | -6.1867416382e+01 |
| 32 | 20050314 | 900 | -1.827 | 280.406 | -9.2169509888e+01 |
| 33 | 20060304 | 900 | -1.827 | 280.125 | -6.3722732544e+01 |
| 34 | 20060328 | 800 | -1.827 | 280.406 | -5.7734420776e+01 |
| 35 | 20060328 | 900 | -1.827 | 280.406 | -1.1018218994e+02 |
| 36 | 20070331 | 2100 | -74.051 | 164.160 | 8.7419113159e+01 |
| 37 | 20090303 | 700 | -1.827 | 280.406 | -8.9056137085e+01 |
| 38 | 20090303 | 800 | -1.827 | 280.406 | -1.3375457764e+02 |
| 39 | 20090303 | 900 | -1.827 | 280.406 | -2.0406346130e+02 |
| 40 | 20091218 | 2100 | 43.138 | 75.000 | -5.9425277710e+01 |
| 41 | 20100325 | 900 | -1.827 | 280.688 | -5.4004959106e+01 |
| 42 | 20110127 | 900 | -1.827 | 280.406 | -5.3115798950e+01 |
| 43 | 20111224 | 2100 | 43.138 | 75.000 | -6.8307769775e+01 |
| 44 | 20130719 | 2100 | -74.051 | 164.160 | -6.1746520996e+01 |
| 45 | 20140426 | 700 | -1.265 | 280.688 | 5.7151275635e+01 |
| 46 | 20140426 | 700 | -1.546 | 280.406 | -8.5247161865e+01 |
| 47 | 20140426 | 800 | -1.265 | 280.688 | 7.2114089966e+01 |
| 48 | 20140426 | 800 | -1.546 | 280.406 | -1.4157341003e+02 |
| 49 | 20140426 | 900 | -1.546 | 280.406 | -2.0927426147e+02 |
| 50 | 20160522 | 2000 | -74.051 | 164.160 | -6.6684082031e+01 |
| 51 | 20160522 | 2100 | -74.051 | 164.160 | -5.9349365234e+01 |
| 52 | 20160929 | 2100 | -74.051 | 164.160 | 6.5295028687e+01 |
| 53 | 20161128 | 2100 | 42.857 | 75.375 | -5.2441085815e+01 |
Table 2: Occurrences when the 10 metre V wind component exceeds 50 ms-1.
| Event | Date | Time | Latitude | Longitude | 10m V |
|---|---|---|---|---|---|
| 1 | 19790401 | 2100 | -5.480 | 137.812 | -9.6993362427e+01 |
| 2 | 19800330 | 900 | -1.827 | 280.406 | -5.0487777710e+01 |
| 3 | 19800831 | 1900 | -5.199 | 137.531 | -6.5852249146e+01 |
| 4 | 19800831 | 2000 | -5.199 | 137.531 | -5.0360015869e+01 |
| 5 | 19821024 | 2100 | -74.051 | 164.160 | 5.4236557007e+01 |
| 6 | 19830930 | 2000 | 42.576 | 84.815 | 5.0510147095e+01 |
| 7 | 19830930 | 2100 | 42.576 | 84.815 | 6.1684814453e+01 |
| 8 | 19840811 | 1800 | -5.480 | 137.812 | 1.3961134338e+02 |
| 9 | 19840811 | 1900 | -5.199 | 137.531 | 1.2407348633e+02 |
| 10 | 19840811 | 2000 | -5.199 | 137.531 | 1.3110269165e+02 |
| 11 | 19840811 | 2100 | -5.199 | 137.531 | 1.2531871033e+02 |
| 12 | 19850812 | 1900 | -5.199 | 137.531 | 6.5993698120e+01 |
| 13 | 19850812 | 2000 | -5.480 | 137.812 | 8.7721923828e+01 |
| 14 | 19850812 | 2100 | -5.480 | 137.812 | 1.1631915283e+02 |
| 15 | 19851116 | 2100 | -5.480 | 137.812 | -8.0120529175e+01 |
| 16 | 19860724 | 900 | -74.051 | 164.160 | 1.3616104126e+02 |
| 17 | 19871016 | 2100 | -74.051 | 164.160 | 6.7936035156e+01 |
| 18 | 19890420 | 2000 | -5.480 | 137.812 | -5.5810119629e+01 |
| 19 | 19890420 | 2100 | -5.480 | 137.812 | -1.2454008484e+02 |
| 20 | 19890711 | 2100 | 38.361 | 78.398 | 1.4824528503e+02 |
| 21 | 19890912 | 900 | -74.051 | 164.160 | 6.3201354980e+01 |
| 22 | 19901117 | 600 | 41.171 | 39.960 | -7.1991546631e+01 |
| 23 | 19901117 | 700 | 41.171 | 39.600 | -7.2909973145e+01 |
| 24 | 19910620 | 2000 | -5.480 | 137.812 | 9.5385955811e+01 |
| 25 | 19910620 | 2100 | -5.761 | 138.094 | 1.6087461853e+02 |
| 26 | 19920415 | 800 | 20.094 | 84.375 | 5.1177642822e+01 |
| 27 | 19921108 | 2100 | -5.199 | 137.531 | -5.9594894409e+01 |
| 28 | 19921113 | 1800 | -5.480 | 137.812 | -7.4539321899e+01 |
| 29 | 19921113 | 1900 | -5.761 | 137.812 | -1.4339295959e+02 |
| 30 | 19921113 | 2000 | -5.480 | 137.531 | -1.5561082458e+02 |
| 31 | 19921113 | 2100 | -5.480 | 137.531 | -1.7285772705e+02 |
| 32 | 19921123 | 2100 | 43.138 | 74.625 | -7.4817504883e+01 |
| 33 | 19930705 | 2000 | 38.361 | 78.398 | 1.7013420105e+02 |
| 34 | 19930705 | 2100 | 38.361 | 78.398 | 6.0669006348e+01 |
| 35 | 19930815 | 2000 | 31.335 | 72.000 | -1.2063990784e+02 |
| 36 | 19950127 | 2100 | 40.890 | 39.600 | -9.3620895386e+01 |
| 37 | 19960710 | 2000 | -5.480 | 137.812 | 7.3640014648e+01 |
| 38 | 19960710 | 2100 | -5.480 | 137.812 | 1.1385275269e+02 |
| 39 | 19970422 | 2100 | 40.890 | 39.240 | -1.3644331360e+02 |
| 40 | 19970617 | 1700 | 39.766 | 89.297 | -1.0041018677e+02 |
| 41 | 19970626 | 1900 | -5.480 | 137.812 | 5.7410095215e+01 |
| 42 | 19970626 | 2000 | -5.480 | 137.812 | 1.2612721252e+02 |
| 43 | 19970626 | 2100 | -5.480 | 137.812 | 8.5113784790e+01 |
| 44 | 19970817 | 2000 | -5.480 | 137.812 | 5.6425781250e+01 |
| 45 | 19970817 | 2100 | -5.480 | 137.812 | 1.4044223022e+02 |
| 46 | 19970923 | 1900 | -74.051 | 164.160 | -5.1563308716e+01 |
| 47 | 20010127 | 600 | 41.171 | 39.960 | 1.2166479492e+02 |
| 48 | 20010127 | 700 | 41.171 | 39.960 | 8.3281478882e+01 |
| 49 | 20020602 | 2100 | 38.923 | 83.320 | -6.7981185913e+01 |
| 50 | 20030516 | 2100 | -5.480 | 137.812 | 6.4198028564e+01 |
| 51 | 20030704 | 2000 | 40.328 | 84.240 | 5.8809799194e+01 |
| 52 | 20040711 | 1800 | 40.328 | 87.480 | 1.6328262329e+02 |
| 53 | 20040711 | 1900 | 40.328 | 87.480 | 7.7149871826e+01 |
| 54 | 20040803 | 2100 | -5.199 | 137.531 | -5.1051910400e+01 |
| 55 | 20040830 | 2000 | -5.199 | 137.531 | -7.2028549194e+01 |
| 56 | 20040830 | 2100 | -5.199 | 137.250 | -1.5628892517e+02 |
| 57 | 20040912 | 2000 | 19.532 | 277.031 | -5.3294830322e+01 |
| 58 | 20050805 | 2000 | -5.480 | 137.812 | -9.3390945435e+01 |
| 59 | 20050805 | 2100 | -5.480 | 137.812 | -9.8295639038e+01 |
| 60 | 20051208 | 800 | 40.890 | 39.960 | 6.6637542725e+01 |
| 61 | 20060304 | 900 | -1.546 | 280.406 | -7.0116149902e+01 |
| 62 | 20060612 | 1900 | -5.480 | 137.812 | 6.8560852051e+01 |
| 63 | 20060612 | 2000 | -5.480 | 137.812 | 1.0062788391e+02 |
| 64 | 20060612 | 2100 | -5.480 | 137.812 | 1.1736833191e+02 |
| 65 | 20061210 | 700 | 41.171 | 39.600 | 5.8087677002e+01 |
| 66 | 20061210 | 800 | 41.171 | 39.600 | 5.1876373291e+01 |
| 67 | 20061219 | 700 | 41.171 | 39.960 | 6.5212203979e+01 |
| 68 | 20061219 | 800 | 41.171 | 39.600 | 5.0869308472e+01 |
| 69 | 20071227 | 600 | 41.171 | 39.600 | 7.9303802490e+01 |
| 70 | 20071227 | 700 | 41.171 | 39.960 | 1.0291072083e+02 |
| 71 | 20071227 | 800 | 41.171 | 39.960 | 8.6426681519e+01 |
| 72 | 20090303 | 900 | -1.827 | 280.406 | -6.8449584961e+01 |
| 73 | 20091218 | 2000 | 43.138 | 74.625 | -6.3902404785e+01 |
| 74 | 20091218 | 2100 | 43.138 | 74.625 | -1.5077589417e+02 |
| 75 | 20100110 | 2100 | 40.890 | 39.960 | -5.4371688843e+01 |
| 76 | 20111207 | 2100 | 41.171 | 39.960 | -5.2954406738e+01 |
| 77 | 20111224 | 2000 | 43.138 | 74.625 | -8.1969665527e+01 |
| 78 | 20111224 | 2100 | 43.138 | 74.625 | -1.0727139282e+02 |
| 79 | 20120629 | 2000 | -5.480 | 137.812 | 6.8156173706e+01 |
| 80 | 20120629 | 2100 | -5.480 | 137.812 | 5.3109390259e+01 |
| 81 | 20130727 | 1900 | 38.080 | 78.333 | 6.0674041748e+01 |
| 82 | 20131224 | 600 | 41.171 | 39.960 | 6.8190124512e+01 |
| 83 | 20131224 | 700 | 41.171 | 39.600 | 6.7012496948e+01 |
| 84 | 20131224 | 800 | 41.171 | 39.600 | 5.1414718628e+01 |
| 85 | 20140426 | 700 | -1.265 | 280.406 | 5.4881195068e+01 |
| 86 | 20140426 | 700 | -2.108 | 280.688 | -5.8466461182e+01 |
| 87 | 20140426 | 800 | -1.546 | 280.688 | -8.5272201538e+01 |
| 88 | 20140426 | 900 | -1.546 | 280.688 | -1.0531086731e+02 |
| 89 | 20150912 | 1900 | -5.199 | 137.531 | 6.4281372070e+01 |
| 90 | 20160516 | 1900 | -5.480 | 137.812 | 1.1651092529e+02 |
| 91 | 20160516 | 2000 | -5.480 | 137.531 | 1.5173913574e+02 |
| 92 | 20160516 | 2100 | -5.480 | 137.812 | 7.3943984985e+01 |
| 93 | 20160531 | 2000 | -5.480 | 137.812 | 8.6714050293e+01 |
| 94 | 20160531 | 2100 | -5.480 | 137.812 | 8.5311660767e+01 |
| 95 | 20160825 | 1900 | -5.480 | 137.812 | 8.8643951416e+01 |
| 96 | 20160825 | 2000 | -5.199 | 137.531 | 6.8540237427e+01 |
| 97 | 20161128 | 2000 | 43.138 | 74.625 | -8.1585525513e+01 |
| 98 | 20161128 | 2100 | 43.138 | 74.625 | -1.6854412842e+02 |
| 99 | 20171011 | 2100 | -5.480 | 137.812 | 1.1839462280e+02 |
| 100 | 20180914 | 2100 | -5.480 | 137.812 | 5.5520050049e+01 |
| 101 | 20191116 | 1800 | -5.480 | 137.812 | 7.6125183105e+01 |
| 102 | 20191116 | 1900 | -5.199 | 137.531 | 1.4759844971e+02 |
| 103 | 20191116 | 2000 | -5.199 | 137.531 | 7.8542388916e+01 |

Figure 2: Locations with 10m wind > 50m/s detailed in tables.
