Introduction
The ERA5 explorer is a web application for exploring historical climate statistics through an interactive map interface, designed and built using the Copernicus Climate Change Service (C3S) Climate Data Store (CDS) Toolbox. This page documents the application, the dataset used and how the statistics are generated.
Dataset
All of the climate statistics generated and visualised by the application are derived from the ERA5 reanalysis dataset, which is available to download and use under the Copernicus licence from the CDS catalogue. The application extracts global ERA5 data from the period from 1979-2018 for the following variables
- Air temperature at 2m at three-hourly intervals (00, 03, 06, 09, 12, 15, 18 and 21 UTC)
- Horizontal component of wind at 10m monthly averages
- Vertical component of wind at 10m monthly averages
- Instantaneous 10m wind gust monthly averages
- Mean total precipitation rate monthly averages.
You can find documentation on the ERA5 dataset here. of ERA5
The information presented by this application for specific cities is based on the nearest grid point to the given city in the ERA5 reanalysis. It is not based on site-specific observations.
Long-term average (reference period)
Climatologies and temperature anomalies in this application have been calculated over the long-term average period of 1981-2010, which is the current WMO climatological standard for long-term averages.
Application
Interactive map
The ERA5 explorer generates an interactive map interface which visualises fields of global average surface temperature, precipitation and wind speed. These averages are calculated slightly differently for each variable:
- Average temperature - the mean of all temperature values extracted from ERA5 at each grid point over the 1981-2010 reference period.
- Average yearly precipitation total - the mean of all precipitation rate values extracted from ERA5 at each grid point over the 1981-2010 reference period, multiplied by 3.14x10¹⁰ (number of seconds in a year (3.14x10⁷) multiplied by number of milimetres in a metre (1000) - see Precipitation units below).
Average wind speed - the mean of all 10m wind speed values extracted from ERA5 at each grid point over the 1981-2010 reference period.
The interactive map also includes a search box for generating climate breakdowns for any selected city from around the world.
Climate breakdown panel
When a user searches for a location in the interactive map described above, the application will generate a breakdown of climate statistics, which are displayed in a pop-up panel on the right-hand side of the screen. The information provided in this panel is broken down into different sections, which can be accessed by selecting drop-down options.
Climate classification
The first piece of information provided for each selected city is its Köppen climate classification. This classification system divides climates into five main groups based on seasonal temperature and precipitation patterns. The groups used by the ERA5 explorer are tropical, dry, temperate, continental and polar, and the criteria for attaining each classification is provided in the table below:
Monthly (climatologies)
Overview

When clicking on the map or searching for a city, the application will show a climatological overview for the selected location. This shows both the temperature and precipitation climatolgies at the location averaged over the 1981-2010 reference period in a single bar chart.
▓ Monthly mean temperature range – the bottom of each bar shows the mean daily minimum temperature for each month, while the top of each bar shows the mean daily maximum temperature.
▓ Monthly mean precipitation – the typical monthly total precipitation, in mm.
Temperature
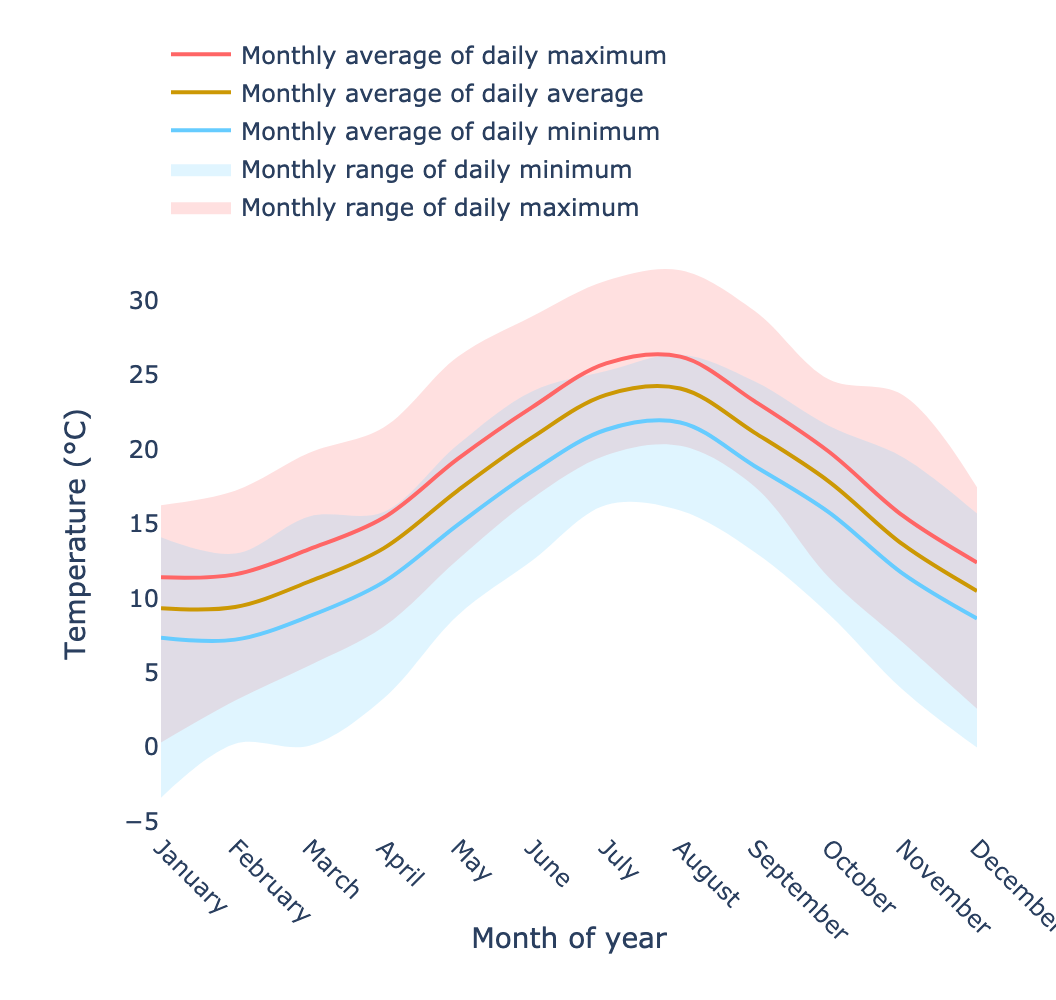
This chart provides a broad overview of the kind of temperatures you might expect at the location based on the time of year. The typical/average temperature values displayed are calculated by finding the monthly mean of different temperature statistics, and then averaging each monthly mean over multiple years in order to produce a climatology, which describes the typical climate.
The statistics displayed in this graphic are as follows:
― Monthly average of daily maximum temperature – the mean of all daily maximum1 temperatures for each calendar month, averaged over the 1981-2010 reference period.
― Monthly average temperature – the mean of all six-hourly temperatures which fall within the given calendar month, averaged over the 1981-2010 period.
― Monthly average of daily minimum temperature – the mean of all daily minimum1 temperatures for each calendar month, averaged over the 1981-2010 reference period.
The chart also displays two shaded regions:
▓ Monthly range of daily minimum temperature – shading between the minimum and maximum daily minimum temperatures for each calendar month, averaged over the 1981-2010 reference period.
▓ Monthly range of daily maximum temperature – shading between the minimum and maximum daily maximum temperatures for each calendar month, averaged over the 1981-2010 reference period.
1 Daily maximum/minimum temperatures are calculated by taking the maximum/minimum of the four six-hourly temperature values extracted from ERA5 for each day.
Precipitation

This chart provides a broad overview of the kind of precipitation totals you might expect at the location based on the time of year.
Units
The units of the ERA5 mean total precipitation rate variable are ms-1 (metres per second). Monthly and yearly totals are presented in the application with units of mm, by scaling the units to mm per month for monthly totals and mm per year for yearly totals. For example, the conversion from ms-1 to mm/year was achieved by multiplying by 3.14x10¹⁰ (number of seconds in a year (3.14x10⁷) multiplied by number of milimetres in a metre (1000)).
Monthly mean precipitation totals
The plot on the left shows typical monthly precipitation totals in mm for the city of Rome. Monthly mean precipitation totals were calculated by finding the average precipitation rate for each month, and then calculating the mean of these monthly averages over multiple years to produce a climatology of typical monthly precipitation rates. These rates were then multiplied by 2.628x10⁹ in order to convert the rates from ms-1 into rates of mm/month (number of seconds in a month (2.628x10⁶) multiplied by the number of milimetres in a metre (1000)).
The data used to calculate the precipitation climatology are for the reference period 1981-2010.
Wind speed and direction

This chart provides a broad overview of the kind of wind speeds and directions you might expect at the location based on the time of year.
The monthly average wind speeds shown are simply the mean of the ERA5 monthly average wind speeds at 10m for the given location, averaged over the reference period 1981-2010.
The wind direction \( \theta \) is calculated using the euqation
\[ \theta = \arctan2(-\pmb {\bar u}, -\pmb {\bar v}) \]where \( \pmb {\bar u} \) and \( \pmb {\bar v}, \) are the mean of the horizontal and vertical components of wind for each month, respectively, averaged over the reference period (1981-2010).
Frost days, summer days and tropical nights
This chart visualises the average monthly percentage of days which can be classified as one of these three categories:
― Frost days are days when the daily minimum temperature falls below 0°C.
― Tropical nights are days when the daily minimum temperature is above 20°C.
― Summer days are days when the daily maximum temperature is above 25°C.
The plot on the right shows the typical percentage of each of these day categories which might be expected to fall within each month of the year. The values displayed are calculated by finding the monthly average percentage of each of the above day categories, and then averaging each monthly average over multiple years (1981-2010).

Annual
Temperature anomaly (warming stripes)
Warming stripes provide an at-a-glance view of yearly temperature differences. The colour of each stripe represents the temperature anomaly for a given year, or how much warmer (red) or colder (blue) that year was compared to the long-term average over the reference period of 1981-2010. The colour palette is scaled so that the greatest positive/negative anomaly is the darkest red/blue.
This graphic was inspired by #ShowYourStripes, designed by Ed Hawkins at the National Centre for Atmospheric Science, University of Reading.


This graphic shows the precipitation anomaly for each year in the 1979-2020 period, or how much more or less precipitation fell each year compared to the long-term average of 1981-2010.
These anomalies are presented as a percentage difference relative to the long-term average - so for example, if the yearly average precipitation at a point was 1000mm, and 750mm fell in a given year, then this would be a precipitation anomaly of -25%.
Years for which the total precipitation was greater than average are plotted as a blue bar, while years with less precipitation than average are plotted as a red bar. The grey line shows the five-year running mean anomaly.
Frost days, summer days and tropical nights
As above, this chart visualises the average percentage of days which can be classified as one of these three categories:
― Frost days are days when the daily minimum temperature falls below 0°C.
― Tropical nights are days when the daily minimum temperature is above 20°C.
― Summer days are days when the daily maximum temperature is above 25°C.
The plot on the right shows the five-year rolling average percentage of each of the above day categories over the 1981-2010 period. The faint lines show the yearly average percentage, while the five-year average is highlighted in order to emphasise longer-term changes.

