Considerations when using output from ECWAM
Interaction of wind-sea and swell
Use of the mean wave height and direction is the simplest method of describing the forecast wave regime in a given area and it is easy to be beguiled into just using this output for forecasts to customers. However, the mean wave direction and height is made up of contributions from wind-sea and swell with different wave periods and they interact in a complex manner. It is important to investigate the forecast wind-sea and swell separately to give an understanding of likely sea conditions in an area (e.g. for a ship requiring a particularly smooth passage) or at a location (e.g. an oil rig).
When wind-sea and swell move in similar directions the wave heights can give information on the likely sea state as one is superimposed on the other, particularly where both have a significant and comparable wave height. On occasion the swell and wind-sea may be moving in opposite directions (an opposing sea) and wave heights give information on the likely rougher sea state to be expected. Often the wind-sea and swell are at right-angles (a cross sea). Where the wind-sea and swell heights are similar the sea can be very disturbed and difficult for shipping. An illustration is given in Figs2.3.2-1(a to e)
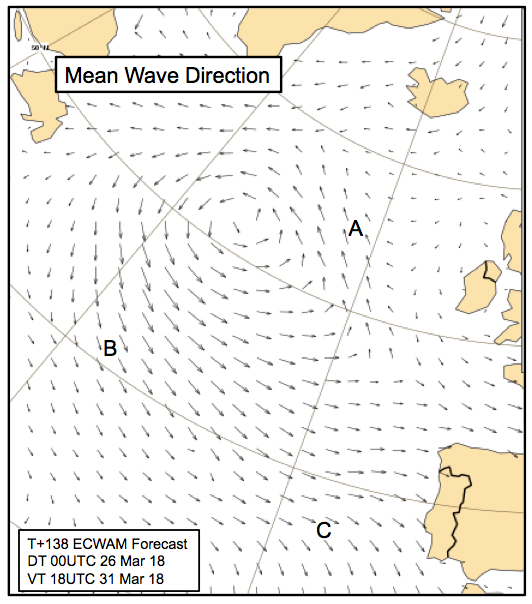
Fig2.3.2-1(a): ecChart of mean wave direction (wave height is indicated by the length of the arrow). On ecCharts, wave height may be shown by use of the probe tool or more graphically by superimposing mean wave heights). This chart gives an overview of wave conditions. Northwesterly waves (i.e. moving towards the northwest) are indicated near point A. Easterly waves i.e. moving towards the east) are indicated near point C. However, it is important to investigate the contributions to the mean wave directions and heights from inspection of the wind-sea and swell at this time.
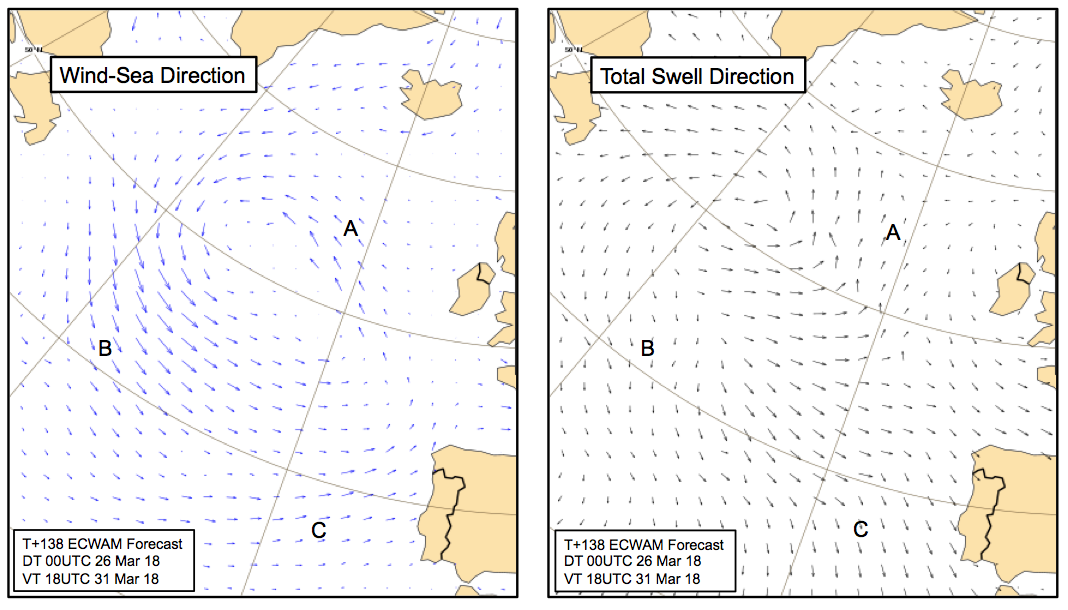
Fig2.3.2-1(b): The forecast wind-sea has developed in response to the forecast winds around a depression in mid-Atlantic. Waves move northwestwards near point A and southeastwards near point B. The length of the arrows near points A & B suggest wave heights are around 3m (wave heights are also available as charts, not shown here). Near point C wind-sea waves are relatively small and move towards the east-northeast.
Fig2.3.2-1(c): The forecast total swell has been developed in response to earlier weather systems elsewhere and has propagated across the Atlantic. Swell is moving northwards near point A and southwestwards near point C with arrow length suggesting wave heights of around 2m (wave heights are also available as charts, not shown here). Near point B swell waves are relatively small and move towards the southeast.
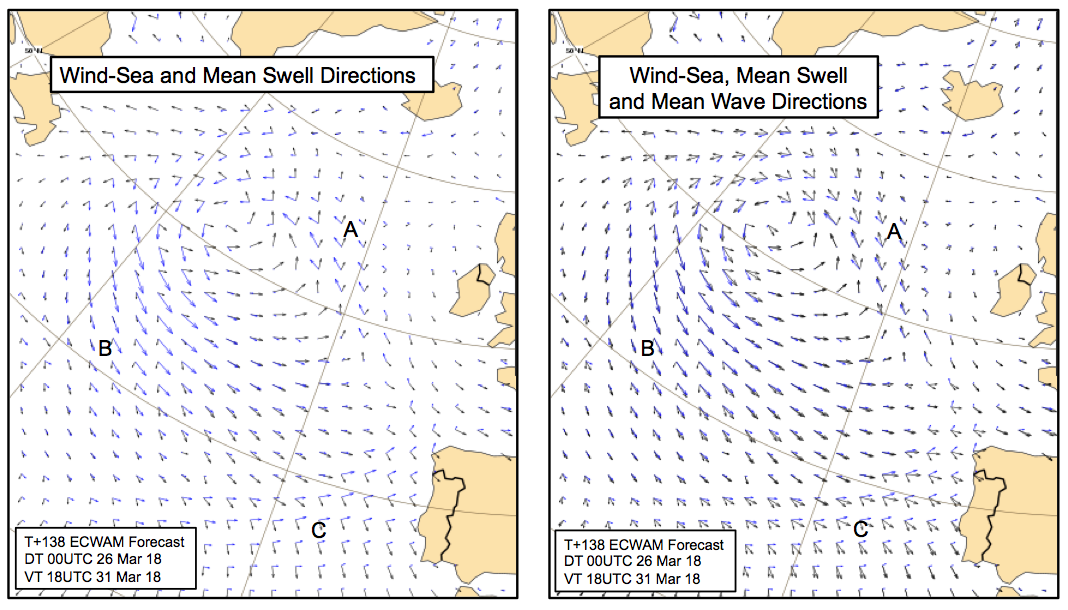
Fig2.3.2-1(d): The forecast wind-sea (blue) and swell (black) shown on a single chart. To the north of point B the wind-sea and swell waves have a similar direction of travel; to the east of point B wind-sea dominates with only weak swell contribution but almost at a right-angle. Near points A and C the wind-sea and swell waves differ widely in direction but with similar heights (a cross sea).
Fig2.3.2-1(e):The forecast mean wave directions derived from the wind-sea and mean swell (as shown in Fig2.3.2-1(a)) superimposed on Fig2.3.2-1(d). This illustrates the important additional information that is gained from consideration of the wind-sea and mean swell forecasts together. The mean wave directions (Fig2.3.2-1(a)) give no indication of that a sea passage to the west of Portugal is likely to be through confused rough seas.
Waves and swell with a long period
Large swell waves with a long period breaking on a beach slope tend to have a large swash with water washed well up the beach. This is often unexpected and takes people by surprise and can cause damage and casualties. Users should note when large waves with a long period are forecast to run onto an exposed coast. Extreme forecast index products for waves can alert users to the potential problem.
Example 1: Large swell off South Africa
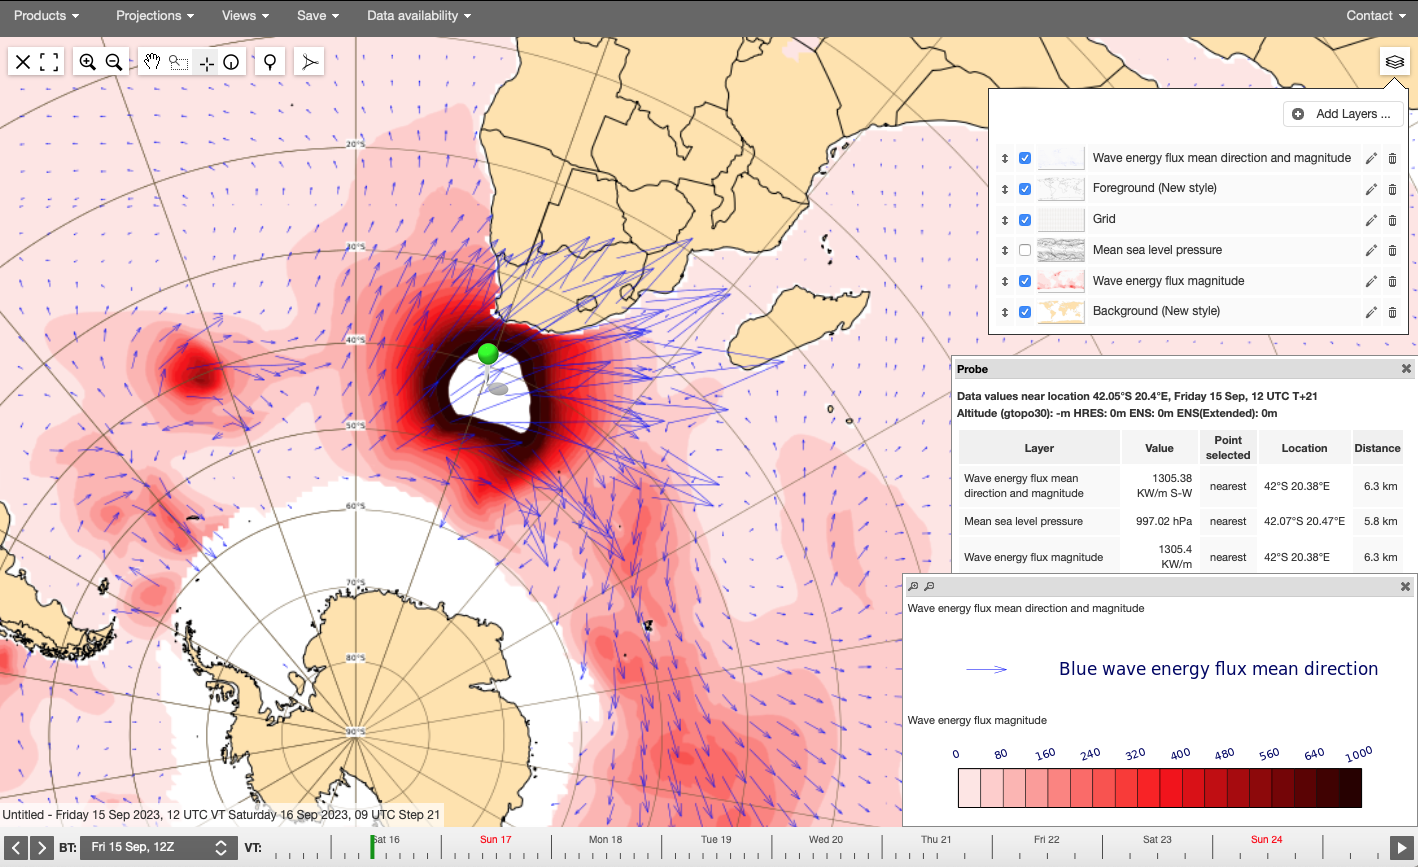
Fig2.3.2-2: Wave energy forecast VT 09UTC 16 Sep 2023, DT 12UTC 15 Sep 2023. The chart shows extreme wave energy flux (~1300KW/m) being driven towards the exposed southern coast of South Africa.
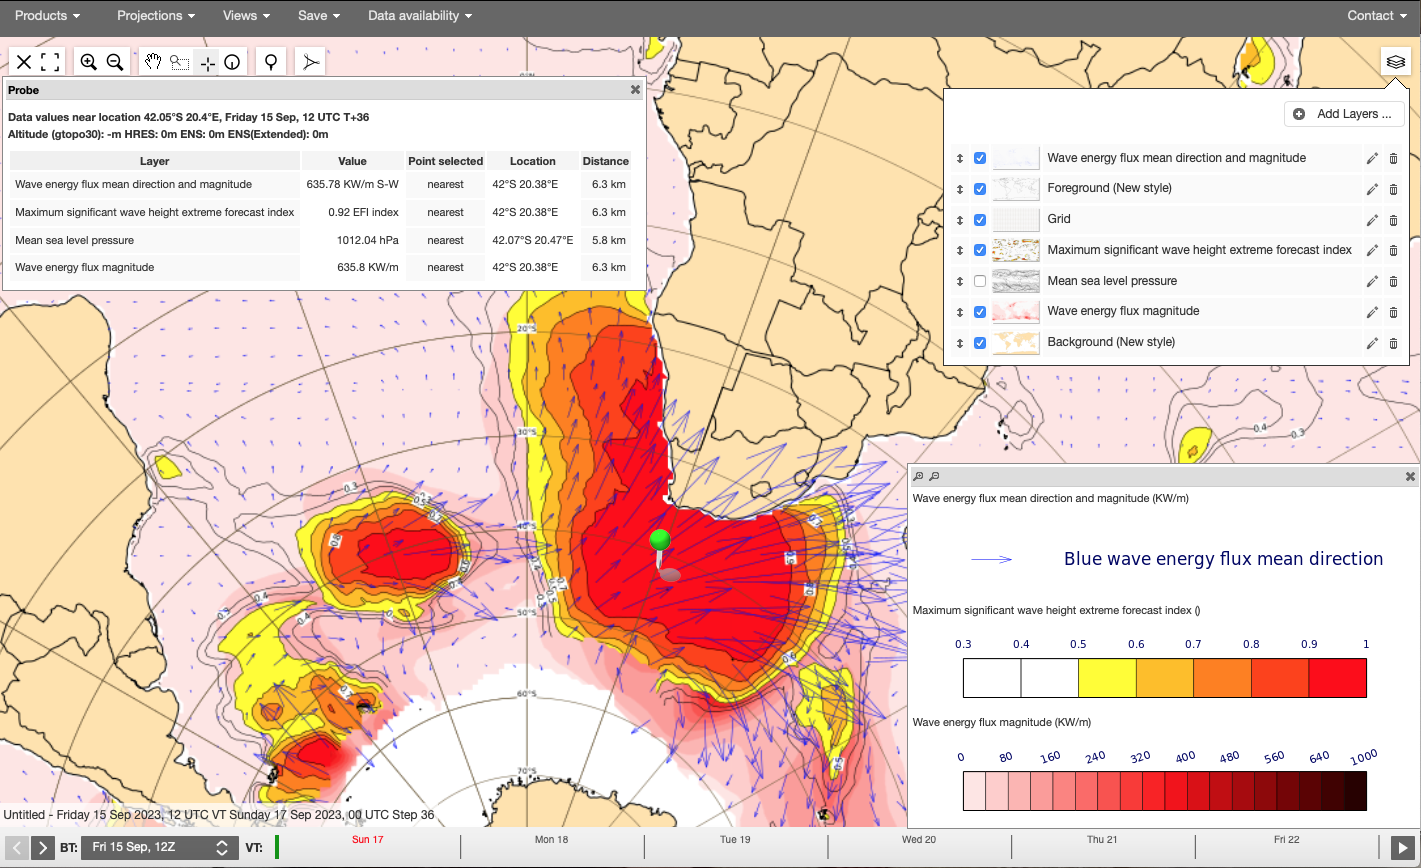
Fig2.3.2-3: Wave energy forecast VT 09UTC 16 Sep 2023, DT 12UTC 15 Sep 2023. The chart shows the extreme forecast index for significant wave height at 0.9 to 1.0 alerting to the significant nature of the ocean swell.
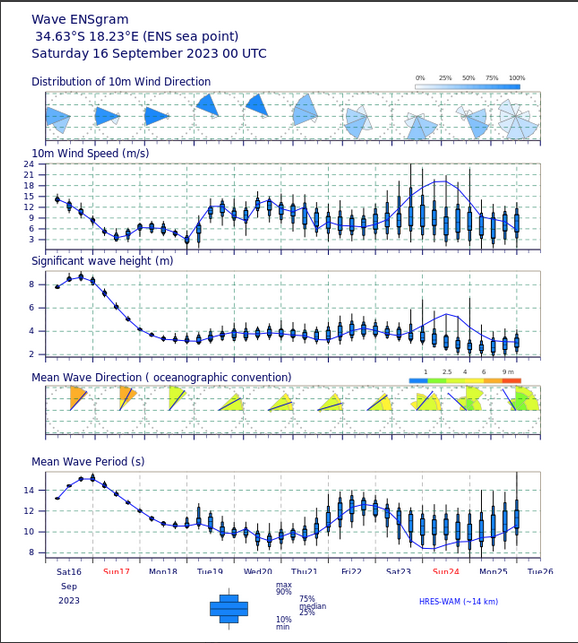
Fig2.3.2-4: Wave ENSgram DT DT 00UTC 16 Sep 2023. Significant wave heights were forecast to exceed 9 m with wave period above 15 s. These values were also observed at a nearby buoy.
Very large waves and swell were induced by a deep depression in southern Atlantic associated with very strong winds. The waves became larger as they approached the coasts and coincided with spring tides. Significant wave heights exceeded 8 m in many places suggesting maximum waves were significantly higher. There was considerable coastal damage and some loss of life.
Example 2: Large swell off Ecuador and Peru
Giant swell (above 6 meters in height) struck the coasts of Ecuador and Peru causing significant damage to boats and infrastructure. The swell originated from a storm lying off California several days earlier and was sufficiently powerful to propagate some 5000km while while maintaining a significant amount of energy. Long period swell was mainly the reason for the damage caused.
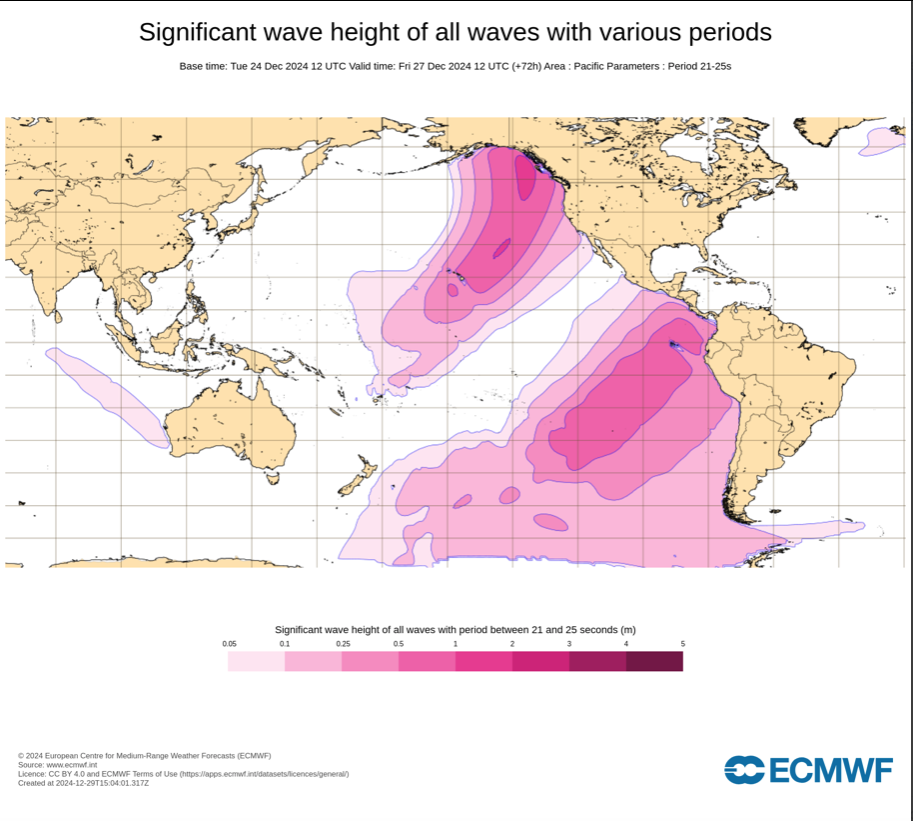
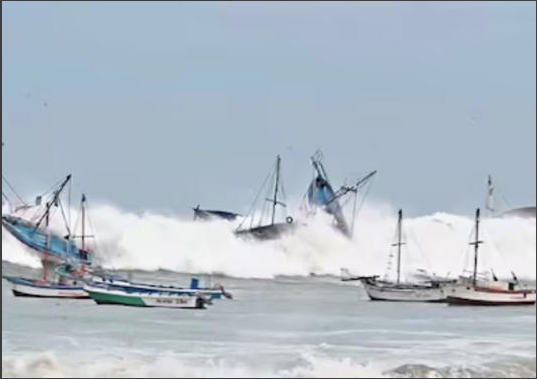
Fig2.3.2-5: Snapshot of propagation of long period (21-25sec) swell from Californian coastal area towards Ecuador and Peru coasts. The significant wave heights are about 1m to 2m but amplification can be expected in shelving coastal waters and swell of some 6m were observed causing destruction.
Sea-surface currents
The interaction of waves with sea-surface currents is not yet included in the operational version of the model. In particular areas, (e.g. Gulf Stream or Agulhas current), the current effect may give rise to localised changes of up to a metre in the wave height.
Users should also note that whilst ECMWF does provide some ocean current output, from its ocean model (as "sea water velocity fields"), the current resolution of ECWAM (~0.25 deg) is insufficient to allow strong gradients in western boundary currents to be captured. This means that stronger currents that are observed around the world tend to be underestimated in this output, sometimes substantially so.
Shoaling
Shoaling is the deformation of waves as they move from the ocean into shallow waters causing the waves to become steeper, increase in height, and have shorter wavelength. The basic equations in ECWAM do represent the effect when the waves propagate from deep to shallow water, but generally the effect is not dramatic over most coastal waters. Waves inshore and at the beach, where shoaling is very strong, are not represented since the resolution of Ensemble Control Forecast (ex-HRES) WAM of 9km cannot represent the actual beach slope. Wave products near coasts, and, to a lesser extent, within small and enclosed basins (e.g. Baltic Sea) may be of lower quality than for the open ocean.
Forecast wave heights depend strongly upon the depth of water held within the IFS. Forecast wave heights can be less accurate because of:
- incomplete resolution by the land-sea mask. Detail of the coast may be deficient.
- unreliable bathymetry information in some areas. Detail of the water depth may be deficient.
- unidentified small islands. This allows shallow waves to propagate unhindered. However, the wave model has a scheme that tries to represent the impact of unresolved islands on the global propagation of waves.
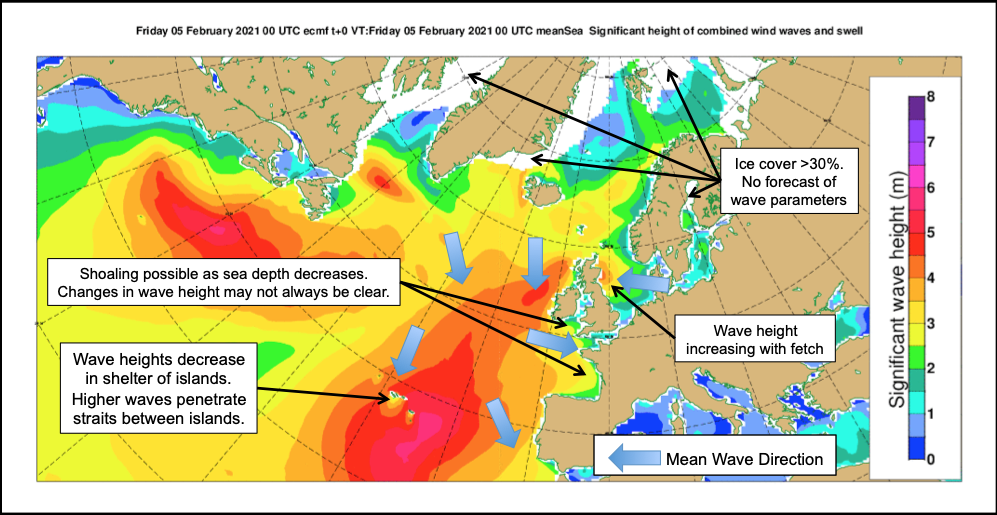
Fig2.3.2-6: An example chart of wind-wave and swell. Some shoaling is possible towards the French and British coasts as the sea becomes less deep but forecast values cannot be absolutely relied upon. See Fig2.3.2-7 for detail around the Azores. No parameters are shown on coasts nor where ice cover >30% (i.e. where some of the grid points used in interpolation of wave data for display are on land or ice. Users should identify whether the ice areas or coastal zones are the cause. See section regarding wave parameters near sea ice)
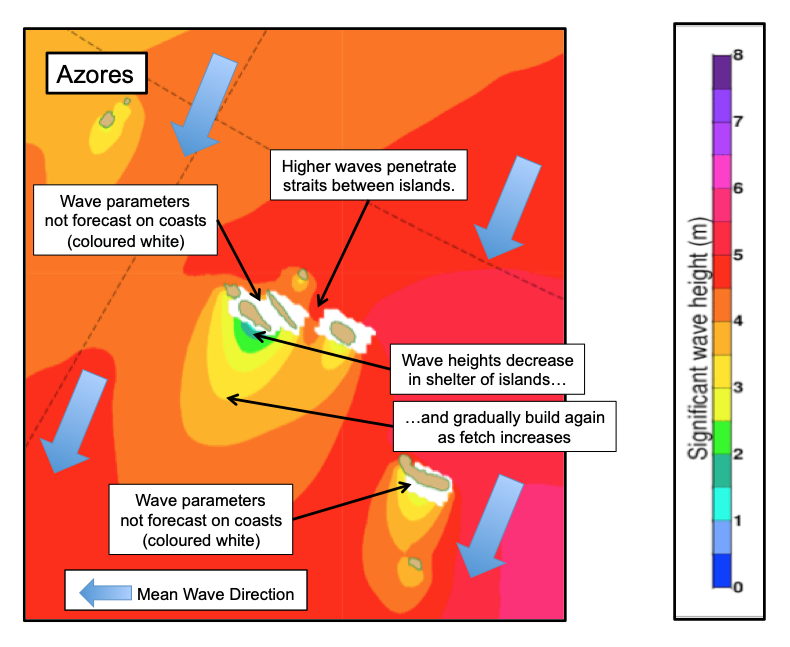
Fig2.3.2-7: The same example chart of wind-wave and swell as in Fig2.3.2-6, magnified near the Azores. There are some areas around the islands where wave parameters are not forecast (i.e. where some of the grid points used in interpolation of wave data are on land) but the detail of coast may not be fully resolved. ECWAM shows re-build of wind waves to the lee of the islands as the wind fetch increases and also the penetration of larger waves through the inter-island straits.
Near sea ice
Sea ice is not static but forms or extends with low air temperature or sea-surface temperatures, and can move with winds and sea current. https://confluence.ecmwf.int/display/FUG/Section+2.4+Dynamic+Ocean+Model+-+NEMO passes information to ECWAM regarding the extent and movement of the sea ice field forecast by LIM2, allowing a more realistic definition of what is open sea throughout the forecast period. In the current operational version of the wave model, the interaction between waves and sea-ice is not actually represented. Where sea ice cover >30% all wave parameters are set to missing (i.e. no valid values). Wave products near ice-edges may be of lower quality than for the open ocean. This may be due to uncertainty in sea-ice cover, or in the detail of an ice edge and consequently also in the boundary of the water area. Spurious areas of ice or incorrect extent of ice will act as if a coastline or island and stop waves from propagating correctly, possibly decaying the waves completely and incorrectly sheltering an otherwise exposed location.
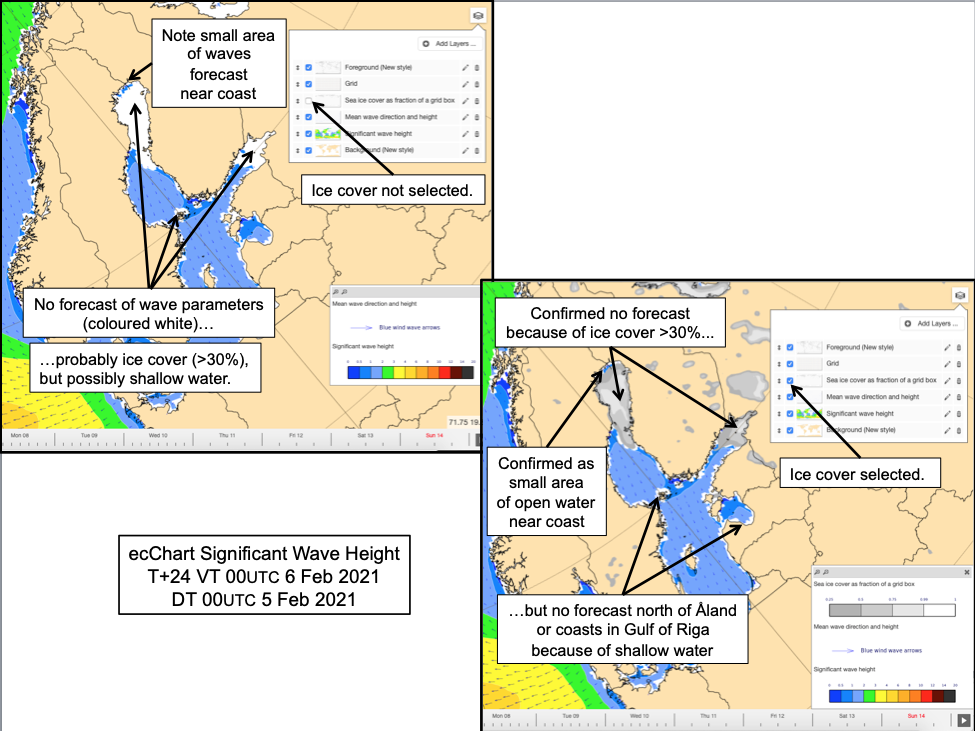
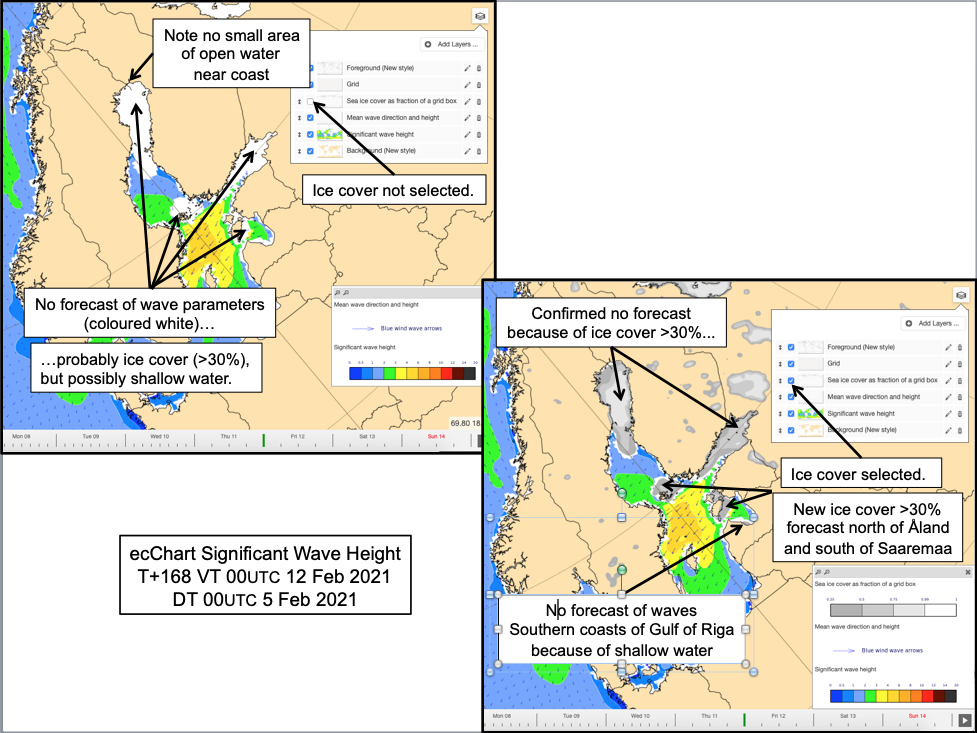
Fig2.3.2-8: Illustration of the importance of distinguishing between ice cover and shallow water when an area of wave parameters is missing.
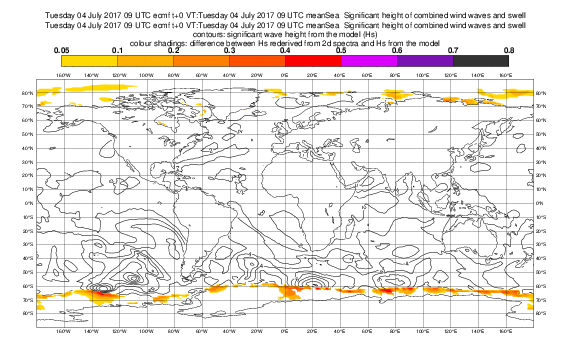
Fig2.3.2-9: Significant height of combined wind waves and swell (Hs). The coloured areas show the difference between the heights derived from the 2d spectra (used where >30% sea ice cover is forecast) and from the wave model (as if open sea). Some large differences are evident, illustrating the need to treat the values of wave height with caution where sea ice is present.
Waves near tropical storms
In the IFS, there is an active two-way coupling between the atmosphere and ocean waves - surface wind stress generates the waves and in turn the waves modulate the wind stress. The ECWAM generally forecasts realistic wave parameters (wave height, period etc).
With sufficiently strong winds, the drag on the low-level air flow is modelled using the Charnock parameter which is used to specify an aerodynamical roughness length scale. In the IFS, this roughness length scale tends to increase with 10m wind speed. However, observational evidence suggests that for exceptionally strong winds the coupling between the ocean surface and the wind becomes less efficient at transferring momentum. So, for exceptionally strong (mean) 10m winds (33m/s) the roughness length scale is capped. This avoids the effect of too much drag on the lower atmosphere and enables more realistic (stronger) winds to be forecast in the vicinity of relatively intense tropical cyclones. Note that tropical cyclone development with strengthened winds has only a limited effect upon the size and character of oceanic wind waves developed by the wave model. The model change to limit the roughness length scale at very high wind speeds was introduced in cycle 47r1 in June 2020.
It is important not to confuse to the aerodynamic roughness length scale with the actual roughness of the sea. The aerodynamic roughness length scale is a parameter concerning the amount of momentum that is exchanged between the atmosphere and the ocean surface via the surface stress. The actual roughness of the sea is concerned with wave heights, wave steepness and how much wave breaking is happening.
Forecast wave heights in exposed coastal areas depend strongly upon the depth of water held within the IFS. The wave model does not take into account variations in sea level. Very low pressure associated with hurricanes, typhoons etc, induces higher sea levels over the normally shallow coastal waters. Oceanic wind waves and swell can approach the coast much further than wave model forecasts show. Also there may be:
- incomplete resolution by the land-sea mask. Detail of the coast may be deficient.
- unreliable bathymetry information in some areas. Detail of the water depth may be deficient.
When considering forecast wave parameters in the vicinity of typhoons, hurricanes etc., it should be remembered that IFS still has difficulties in producing some intense tropical cyclones and their subsequent motion.
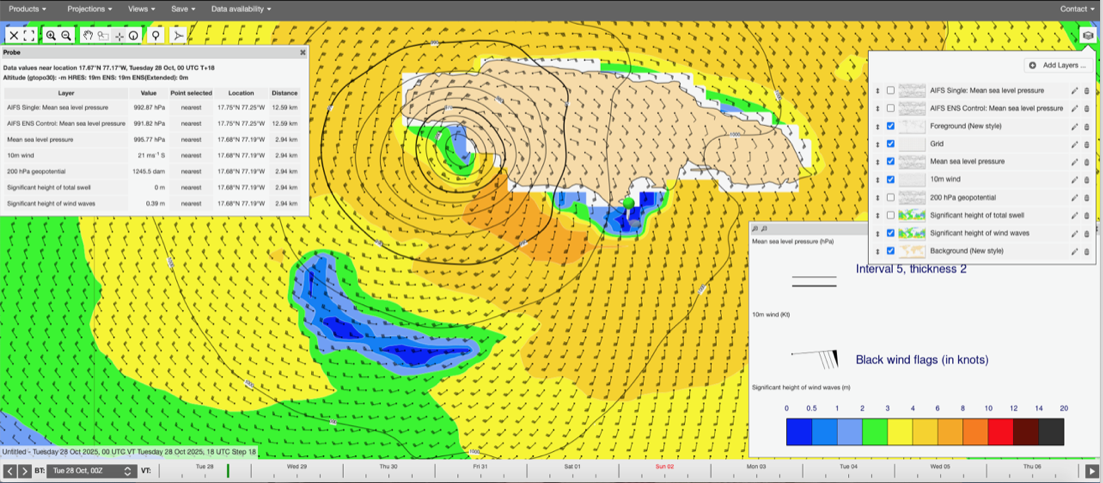
Fig2.3.2-10: An example of forecast wind wave heights associated with category 5 hurricane Melissa just reaching west Jamaica. DT00UTC 28 Oct 2025, VT 18UTC 23 Oct 2025. Open ocean wind wave heights are forecast (around 6m-8m). Forecasts of lower wind wave heights (around 2m-4m) to the north of Jamaica are largely due to less extreme winds in the shelter of the island. The forecast wind wave heights on the lee shore near the mid-south of Jamaica (0m-1m) are incorrect. In the current wave model the water depth in this area is ~3m which induces waves to break with a substantial reduction in wave heights. In reality, deeper water associated with the storm surge would allow much larger waves to penetrate into the coast.
Overview
Community Forums
Content Tools