Interpolation of temperature at 1000 hPa affected by:
- MIR using an intermediate full (regular) Gaussian grid at a resolution corresponding to the target lat-lon resolution for the spectral to grid transformation followed by grid-to-grid interpolation
- MIR using a more accurate truncation of the spectral series corresponding to the target grid resolution to avoid ripples from aliasing effects
HRES T1279
- For transformations to high resolution target grids (0.1x0.1 and 0.125x0.125) for which no spectral truncation occurs
- differences are at most +/-3K
- differences are smaller than +/-1K for more than 99% of grid points
These differences are due to MIR making the spectral transformation to an intermediate Gaussian grid followed by grid-to-grid interpolation to the regular lat-lon grid whereas EMOSLIB transforms directly to the lat-lon target grid. - For transformations to lower resolution target grids
- the maximum and minimum differences are significantly larger.
- differences are smaller than +/-2K for more than 99% of grid points
- larger differences are due to sub-optimal default truncation of the spectral series used by EMOSLIB:
- EMOSLIB uses truncation=T799 for a 0.25x0.25 target grid compared to the theoretical ideal used by MIR of truncation=T719
- EMOSLIB uses truncation=T319 for a 0.5x0.5 target grid compared to the theoretical ideal used by MIR of truncation=T359
- EMOSLIB uses truncation=T213 for a 1.0x1.0 target grid compared to the theoretical ideal used by MIR of truncation=T179
Consequently, fields produced by EMOSLIB are more affected by 'aliasing' than those produced by MIR. - Generally, the use of the intermediate grid with MIR produces smoother fields.
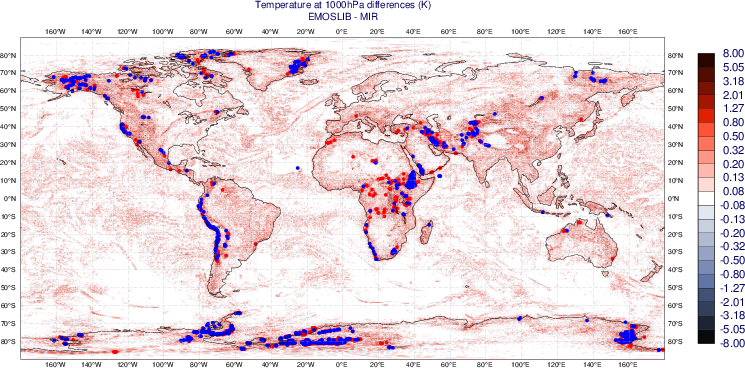
The plots show the differences with the contours chosen on a logarithmic scale to enhance the smaller differences. Differences smaller than 0.1% of the field range are not shown. Grid points where the absolute difference is greater than 50% of the maximum absolute difference are indicated with red (EMOSLIB greater than MIR) and blue (EMOSLIB less than MIR) filled circles.
| Target resolution | Statistics of differences | Histogram of differences | Global | Europe |
|---|
| 0.1x0.1 | Maximum difference = 1.693253
Minimum difference = -1.505966
Mean absolute difference = 0.022411
Median absolute difference = 0.009872
Standard deviation = 0.047950
RMS of differences = 0.047950 Percentage of points with absolute difference < 0.5 = 99.914%
< 1.0 = 99.994%
< 2.0 = 100.000% | -2.5 : -1.5 - 4 ( 0.000062%)
-1.5 : -0.5 - 2959 ( 0.045638%)
-0.5: 0.5 - 6478007 ( 99.913736%)
0.5 : 1.5 - 2603 ( 0.040147%)
1.5 : 2.5 - 27 ( 0.000416%)
| | |
| 0.125x0.125 | Maximum difference = 2.510147
Minimum difference = -2.505478
Mean absolute difference = 0.033943
Median absolute difference = 0.015244
Standard deviation = 0.072670
RMS of differences = 0.072670 Percentage of points with absolute difference < 0.5 = 99.703%
< 1.0 = 99.965%
< 2.0 = 99.999% | -3.5 : -2.5 - 2 ( 0.000048%)
-2.5 : -1.5 - 138 ( 0.003325%)
-1.5 : -0.5 - 6237 ( 0.150286%)
-0.5 : 0.5 - 4137753 ( 99.702970%)
0.5 : 1.5 - 5805 ( 0.139877%)
1.5 : 2.5 - 144 ( 0.003470%)
2.5 : 3.5 - 1 ( 0.000024%)
| | |
| 0.25x0.25 | Maximum difference = 8.004074
Minimum difference = -7.327957
Mean absolute difference = 0.114489
Median absolute difference = 0.050949
Standard deviation = 0.244372
RMS of differences = 0.244372 Percentage of points with absolute difference < 0.5 = 96.187%
< 1.0 = 98.910%
< 2.0 = 99.820% | -8.5 : -7.5 - 0 ( 0.000000%)
-7.5 : -6.5 - 1 ( 0.000096%)
-6.5 : -5.5 - 11 ( 0.001059%)
-5.5: -4.5 - 19 ( 0.001830%)
-4.5 : -3.5 - 87 ( 0.008380%)
-3.5 : -2.5 - 339 ( 0.032651%)
-2.5: -1.5 - 1667 ( 0.160560%)
-1.5 : -0.5 - 17696 ( 1.704423%)
-0.5 : 0.5 - 998656 ( 96.187394%)
0.5 : 1.5 - 17694 ( 1.704230%)
1.5 : 2.5 - 1590 ( 0.153144%)
2.5 : 3.5 - 325 ( 0.031303%)
3.5 : 4.5 - 91 ( 0.008765%)
4.5 : 5.5 - 40 ( 0.003853%)
5.5 : 6.5 - 16 ( 0.001541%)
6.5 : 7.5 - 5 ( 0.000482%)
7.5 : 8.5 - 3 ( 0.000289%) | | |
| 0.5x0.5 | Maximum difference = 13.379105
Minimum difference = -9.935349
Mean absolute difference = 0.206355
Median absolute difference = 0.101761
Standard deviation = 0.414993
RMS of differences = 0.414999 Percentage of points with absolute difference < 0.5 = 90.877%
< 1.0 = 97.080%
< 2.0 = 99.299% | -13.5 : -12.5 - 0 ( 0.000000%) 0 ( 0.000000%)
-12.5 : -11.5 - 0 ( 0.000000%) 0 ( 0.000000%)
-11.5 : -10.5 - 0 ( 0.000000%) 0 ( 0.000000%)
-10.5 : -9.5 - 2 ( 0.000769%) 2 ( 0.000769%)
-9.5 : -8.5 - 2 ( 0.000769%) 2 ( 0.000769%)
-8.5 : -7.5 - 4 ( 0.001539%) 4 ( 0.001539%)
-7.5 : -6.5 - 11 ( 0.004232%) 11 ( 0.004232%)
-6.5 : -5.5 - 30 ( 0.011542%) 30 ( 0.011542%)
-5.5 : -4.5 - 51 ( 0.019621%) 51 ( 0.019621%)
-4.5 : -3.5 - 114 ( 0.043860%) 114 ( 0.043860%)
-3.5 : -2.5 - 319 ( 0.122730%) 319 ( 0.122730%)
-2.5 : -1.5 - 1212 ( 0.466297%) 1212 ( 0.466297%)
-1.5 : -0.5 - 10435 ( 4.014697%) 10435 ( 4.014697%)
-0.5 : 0.5 - 236207 ( 90.876808%) 232907 ( 89.607187%)
0.5 : 1.5 - 9823 ( 3.779240%) 9823 ( 3.779240%)
1.5 : 2.5 - 1218 ( 0.468606%) 1218 ( 0.468606%)
2.5 : 3.5 - 300 ( 0.115420%) 300 ( 0.115420%)
3.5 : 4.5 - 110 ( 0.042321%) 110 ( 0.042321%)
4.5 : 5.5 - 39 ( 0.015005%) 39 ( 0.015005%)
5.5 : 6.5 - 18 ( 0.006925%) 18 ( 0.006925%)
6.5 : 7.5 - 11 ( 0.004232%) 11 ( 0.004232%)
7.5 : 8.5 - 7 ( 0.002693%) 7 ( 0.002693%)
8.5 : 9.5 - 2 ( 0.000769%) 2 ( 0.000769%)
9.5 : 10.5 - 2 ( 0.000769%) 2 ( 0.000769%)
10.5 : 11.5 - 2 ( 0.000769%) 2 ( 0.000769%)
11.5 : 12.5 - 0 ( 0.000000%) 0 ( 0.000000%)
12.5 : 13.5 - 1 ( 0.000385%) 1 ( 0.000385%)
| | |
| 1.0x1.0 | Maximum difference = 9.762299
Minimum difference = -10.036530
Mean absolute difference = 0.340498
Median absolute difference = 0.180267
Standard deviation = 0.635313
RMS of differences = 0.635347 Percentage of points with absolute difference < 0.5 = 81.599%
< 1.0 = 93.099%
< 2.0 = 98.275% | -10.5 : -9.5 - 2 ( 0.003069%)
-9.5 : -8.5 - 10 ( 0.015347%)
-8.5 : -7.5 - 11 ( 0.016882%)
-7.5 : -6.5 - 5 ( 0.007673%)
-6.5 : -5.5 - 15 ( 0.023020%)
-5.5 : -4.5 - 31 ( 0.047575%)
-4.5 : -3.5 - 95 ( 0.145795%)
-3.5 : -2.5 - 190 ( 0.291590%)
-2.5 : -1.5 - 696 ( 1.068140%)
-1.5 : -0.5 - 5038 ( 7.731737%)
-0.5 : 0.5 - 53170 ( 81.599141%)
0.5 : 1.5 - 4915 ( 7.542971%)
1.5 : 2.5 - 670 ( 1.028238%)
2.5 : 3.5 - 167 ( 0.256292%)
3.5 : 4.5 - 65 ( 0.099754%)
4.5 : 5.5 - 39 ( 0.059853%)
5.5 : 6.5 - 17 ( 0.026090%)
6.5 : 7.5 - 10 ( 0.015347%)
7.5 : 8.5 - 11 ( 0.016882%)
8.5 : 9.5 - 2 ( 0.003069%)
9.5 : 10.5 - 1 ( 0.001535%) | | |