...
"Mixed picture" means marked regional variations. The maximum change at any location in any of these classes is about 15%. Regional average changes, over summer and winter seasons, at a 48-hour lead time, are illustrated on the following plot (Warm colours mean more cloud in 47r2).

High cloud in particular tends to show more sharply defined edges in 47r3. The example below highlights far more areas of cloud cover >99% (i.e. >0.99), and similarly a much reduced spatial coverage of areas with 50-99% cover. It should be added that the non-opaque nature of high cloud makes defining full cover in a meaningful way rather difficult.
...
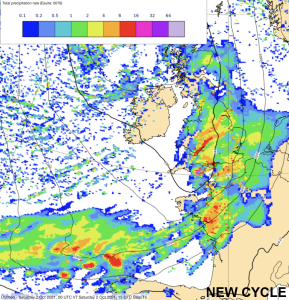
The plots below, from a day with heavy rain in NW Europe, nicely illustrate point 2 above (plots of rainfall rate with mslp are added in each case as a reference point). One can also see that any counteracting effect of the highest rainfall rates tending to be even higher in 47r3 is negligible by comparison.
|
|
|
|


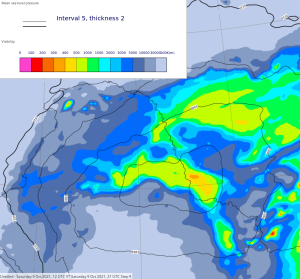
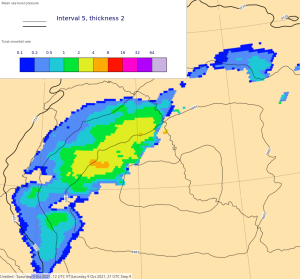
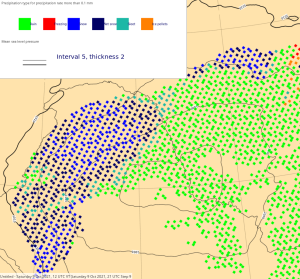
The following panels compare visibility in an October case over northernmost China. 47r3 looks much more realistic with lower values in the snow than in the rain; the opposite was seen in 47r2.
| 47r2 |
| |||
| 47r3 |

...
Wind gusts
The 10m wind gust parametrisation has been changed in two ways in cycle 47r3; the first change reduces the standard 'turbulent gusts' by 7%, the second change reduces the convective gust addition by 50% (whenever it is applied). The net result is slightly lower gusts overall, albeit with the size of the impact depending on the situation.
...