...
You should now see a new GRIB icon in your Metview window:
XXX![]()
If it does not appear immediately, press F5 (or View | Reload).
When you right-click on an icon, a context-sensitive menu appears.

Choose examine to quickly see the structure of the GRIB file.
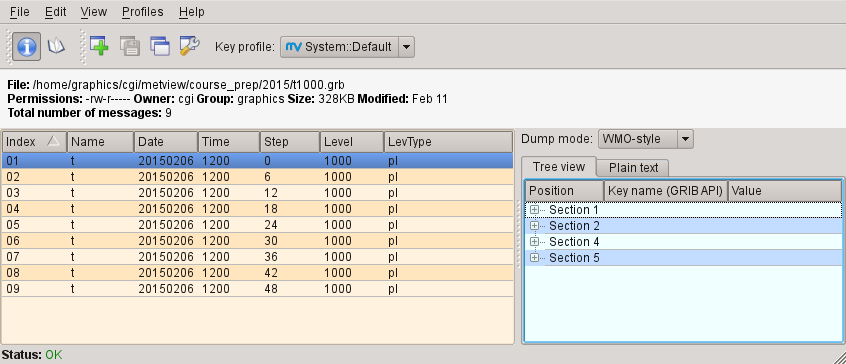
XXXX It contains multiple fields, each listed in the left-hand panel of the GRIB Examiner. We will look more closely at this tool later, but for now close it.
To visualise this data, right-click on its icon and select visualise. You will now see the Display Window. Its toolbars can all be moved, docked, undocked and hidden to suit your preferences.
XXXXX
Antialiasing
![]()

To the right of the zoom buttons should be the Antialias button. When active, a smoothing is applied to the lines in the plot – it is worth doing although it comes at the cost of a small amount of plotting speed. This setting will be remembered the next time you visualise data. Note that the antialiasing is not carried through to the various export image formats (see later) – it is active only in the interactive window.
Zooming in a Plot


The diagram to the left shows the Zoom toolbar at the top of the Display Window. Click the Zoom button to enter ‘zoom mode’. Now you can select an area by dragging with the left mouse button. You can zoom in as many times as you like. In order to ‘undo’ or ‘redo’ a zoom, click the Zoom out or Zoom in buttons respectively. The Zoom stack provides quick visual access to the current zoom history. Notice that when a new area is selected, the contours are recalculated - you see more detail as you zoom into a smaller area; you may also see more detailed coastlines.
Using the Magnifier


The Magnifier button in the toolbar toggles the magnifier tool on and off. Unlike Zoom, this is a purely graphical enlargement of the plot. It is usedmainly to inspect small text such as contour labels. The magnifying glass can be moved and resized using the mouse, and the magnification scale on its left-hand side can also be adjusted.


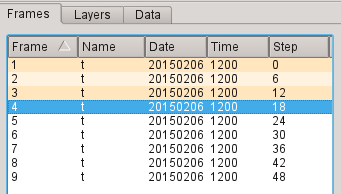
Animation Steps

| Section | ||||
|---|---|---|---|---|
|

...