...
| Section | ||||
|---|---|---|---|---|
|
Creating and Editing an Icon
...
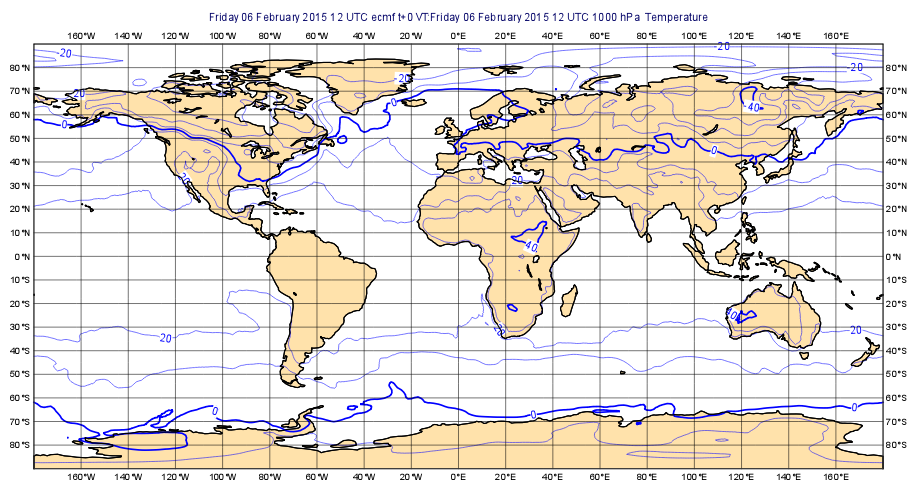
First, create a new Coastlines icon. You can right-click within the Metview desktop to obtain a context menu from where the option Create new icon is available (shortcut: CTRL-N).
XXX
XXXX
This brings up a dialogue from where you can find the Coastlines icon; either double-click the icon, or drag it onto the desktop to create a new instance. Close the dialogue.
...
For colour-based parameters, there are two small arrows - the one on the right reveals a drop-down list of predefined colours (use this one); then one on the left reveals an advanced colour selection tool.
XXXX
After making these changes, click the Ok button to save and exit the editor.
...
Your Coastlines icon can be dragged into any plot, and later we’ll see how to store useful icons so that they can be easily accessed from anywhere.
Changing the Map Projection and Storing the Area
...


