...
The Magnifier button in the toolbar toggles the magnifier tool on and off. Unlike Zoom, this is a purely graphical enlargement of the plot. It is usedmainly to inspect small text such as contour labels. The magnifying glass can be moved and resized using the mouse, and the magnification scale on its left-hand side can also be adjusted.

Animation Steps
...
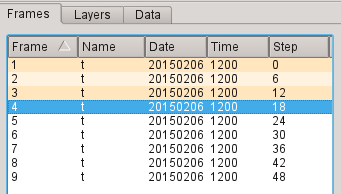
The Frames tab to the right of the plot shows the set of fields contained in the GRIB file. You can move between fields by clicking within this tab, by using the animation control buttons or by using the cursor keys. Note that each plot is computed only when you select a field. Generated plots are cached, indicated in the Frames tab through shading. This can quicken their rendering when the plots are complex. Note that modifying the plot in any way (such as zooming) clears the cache.
| Column |
|---|
|

Layer Meta-data
...
...
There are three tabs in this panel - Frames, Layers and Data. We will look at Layers soon, but for now select the Data tab.
This reveals a page of meta-data for the current layer, including a histogram.
We will investigate these features in more detail later, but for now close the Display Window.
...

Creating and Editing an Icon
...
Now we want to set the area used in the view. Although we can interactively zoom into smaller areas in the Display Window, we now want to store a particular area so that we can use exactly the same one again and again. Set the Map Area Definition to Corners and click on the Geography Tool button next to the Area parameter (shown in the picture abovebelow).
XXX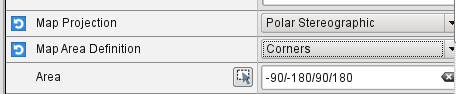
This tool helps you define a region.
XXX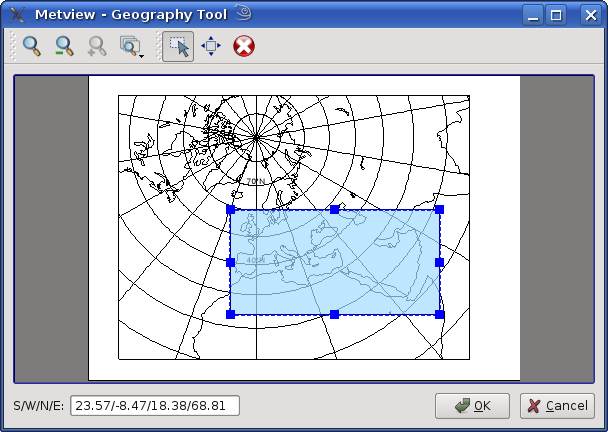
Use the Zoom tools to enlarge the European area and use the Area tool to select a region over Europe. Click Ok to save your selection - your choices will now be updated in the Geographic View editor. Click Apply in the Geographical View editor to save everything. Plot your data in this view to confirm that the area and projection are as desired.
...